Gender Differentiation in Pet Ownership Across Indonesia
Pet ownership sits at the intersection of household lifestyle decisions, personal attachment, and discretionary spending. In Indonesia, where diverse living arrangements and urban density vary considerably, the decision to keep pets carries practical, cultural, and economic dimensions that differ across demographic groups, making gender a relevant lens for understanding ownership patterns.
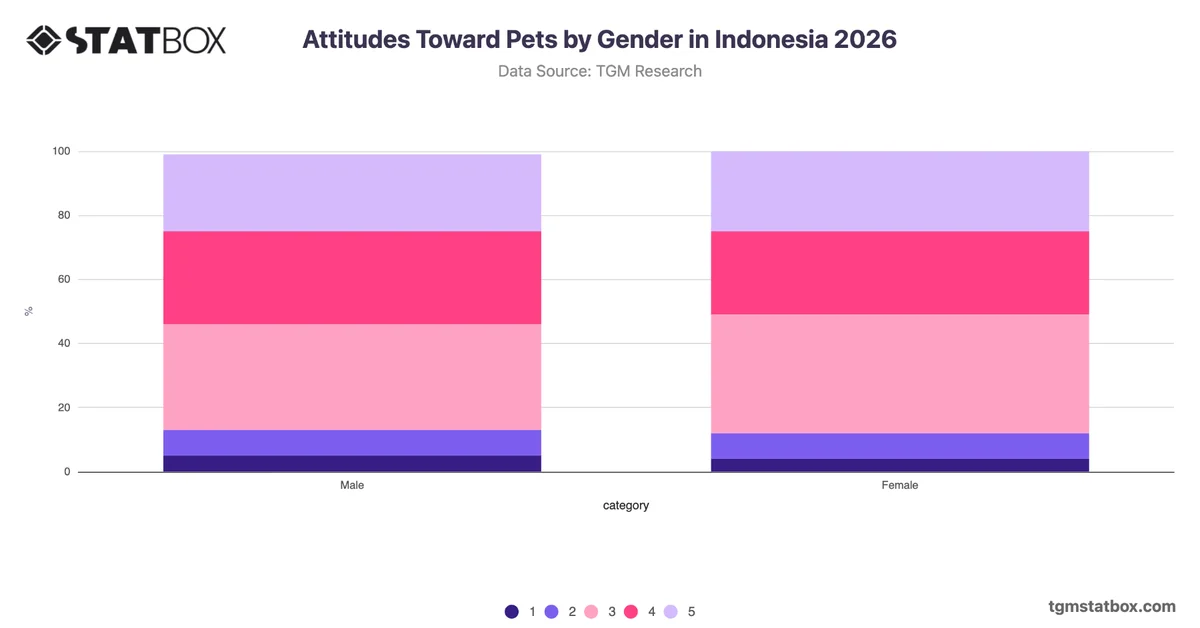
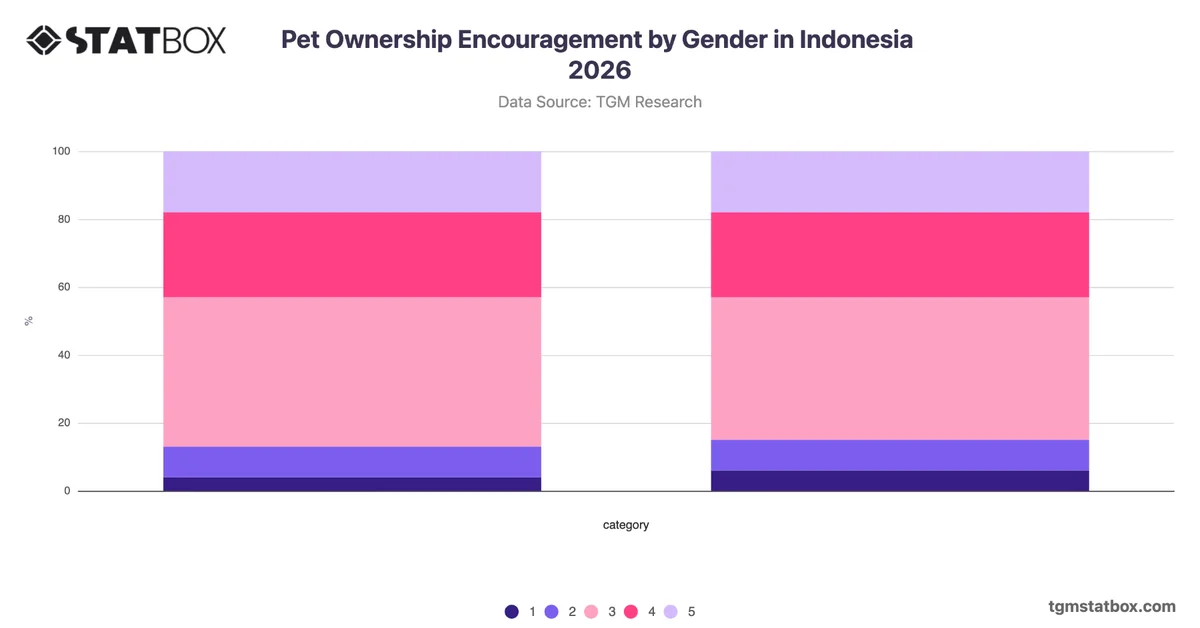
Pet ownership in Indonesia is broadly consistent across gender lines, with 65% of male respondents and 62% of female respondents currently keeping pets. The three-percentage-point gap is narrow and suggests weak differentiation by gender rather than a meaningful divide in ownership behaviour. The more notable finding is the overall majority ownership rate among both groups, indicating that pet keeping is a relatively common household practice regardless of gender. This consistency points to a broadly shared consumer base rather than a segment defined by demographic contrast. For organisations operating in the pet category, including food, healthcare, and accessories, the data suggests that gender-neutral positioning may be more appropriate than gender-targeted segmentation. Marketers and product developers would benefit from investigating other variables, such as household size, urban versus rural location, or pet type, to identify more actionable differentiation within the Indonesian market.