Attitudes Toward Pets in Peru 2024

Attitudes Toward Pets in Peru 2024

Share the statistic on social media channels or embed the statistic in your website using "Embed Code", where available.

Share chart

Embed chart
Select Citation

Cite this statistic and select one of the following formats: APA, Chicago, Harvard, MLA & Bluebook


  • APA
  • Chicago
  • Harvard
  • MLA
  • Bluebook
  • IEEE
TGM StatBox. (2024). Attitudes Toward Pets in Peru 2024. TGM StatBox.
Chart Details
Timeframe: 2024
Country: Peru
Type of survey: CAWI
Number of respondents: 957
Age group: 18 - 64
Published date: 2024
Survey Question: "What is your attitude towards pets?"
Key Takeaways
In Peru, pet ownership is characterized by a mix of preferences and feelings towards animals. According to survey results, 41.3% of respondents express a fondness for all pets, while 47.9% prefer specific types of pets. A small percentage, 5.1%, express dislike for pets, and 5.6% claim indifference.

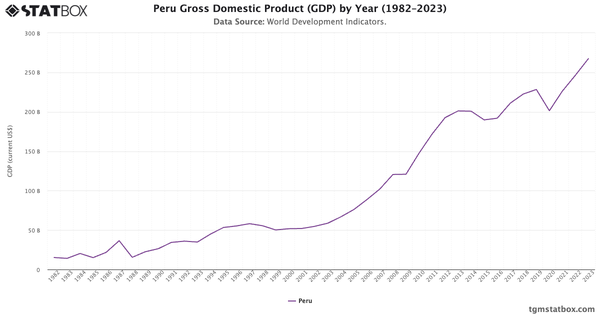
Explore related charts to gain a better understanding of most popular pets in Peru, most popular pet services in Peru, most popular cat food brands in Peru.

Would you like to know more?
Check our report on this topic

Pet Care Insights Report in Peru

Pet Care Report in Peru 2024

Pet Care Insights Report in Peru

Discover all you need to know about Pet Care in Peru with TGM StatBox. Get the comprehensive report, featuring graphs and tables for insights.

Go to report

Further Recommended Statistics

Statbox vector
Statbox |form contact icon

Have Other Queries?

Statbox vector

Connect with our expert team for immediate assistance or comprehensive market analysis. We are always ready to support your business needs.