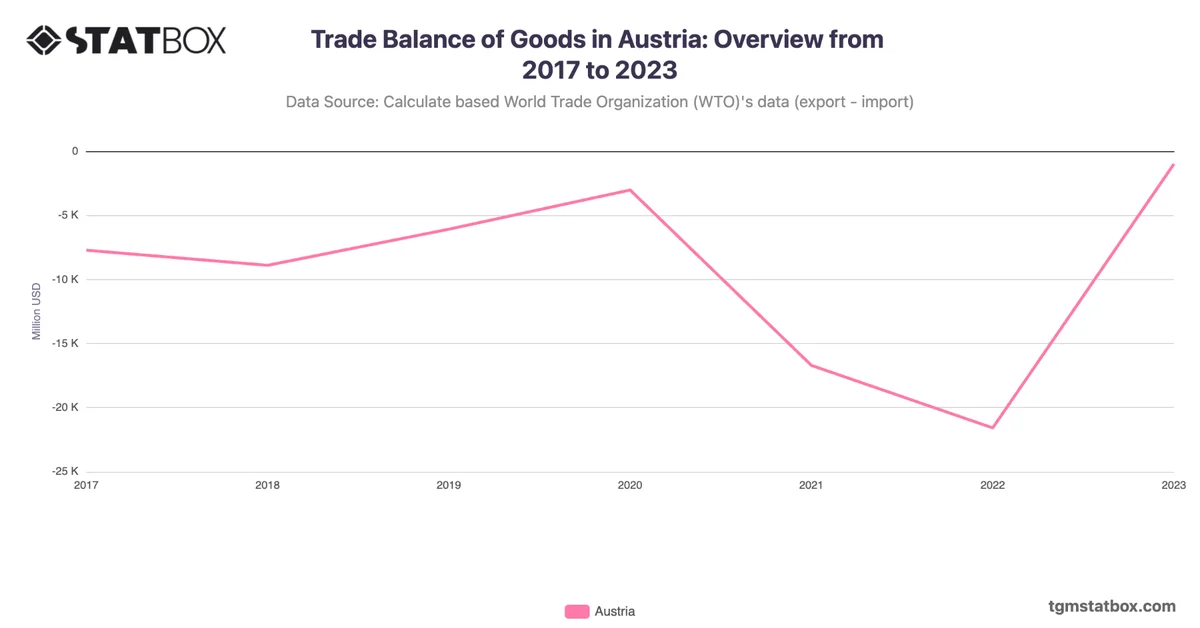
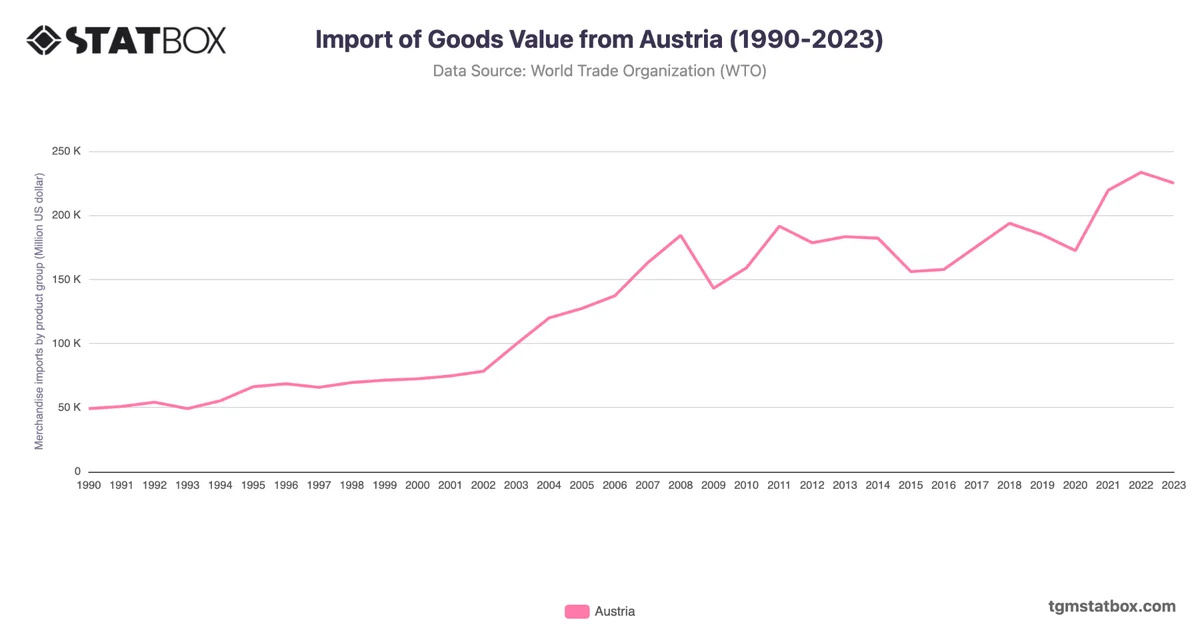
Austria's export growth mirrors its integration into the European and global markets. Exports rose from $41.3 billion in 1990 to $118.4 billion by 2004, driven by industrial goods and closer EU ties. The 2008 financial crisis caused a temporary decline, with exports falling to $137 billion in 2009.
Recovery was swift, supported by strong demand for machinery and pharmaceuticals, with exports exceeding $211.9 billion by 2022. Austria's adaptability in high-value sectors ensures steady performance despite economic fluctuations, highlighting its strategic position in European trade networks.
Recovery was swift, supported by strong demand for machinery and pharmaceuticals, with exports exceeding $211.9 billion by 2022. Austria's adaptability in high-value sectors ensures steady performance despite economic fluctuations, highlighting its strategic position in European trade networks.
For additional information, visit statistics on Austria’s import value, Austria’s population figures, Austria’s manufacturing sector GDP share.