Austria's inflation remained steady in the early 1990s, peaking slightly at 3.4% in 1992 before declining below 2% by 1996. Economic stability characterized much of the 2000s, with inflation fluctuating between 1-2% until the 2008 financial crisis, when it rose to 3.2%. Post-crisis, inflation moderated to around 1.5% by 2019.
The COVID-19 pandemic and the energy crisis drove inflation to 8.6% in 2022. Although high, rates are projected to decline to 2.1% by 2029 as global conditions stabilize. This reflects Austria's resilience and alignment with broader European economic trends in managing inflationary pressures.
The COVID-19 pandemic and the energy crisis drove inflation to 8.6% in 2022. Although high, rates are projected to decline to 2.1% by 2029 as global conditions stabilize. This reflects Austria's resilience and alignment with broader European economic trends in managing inflationary pressures.
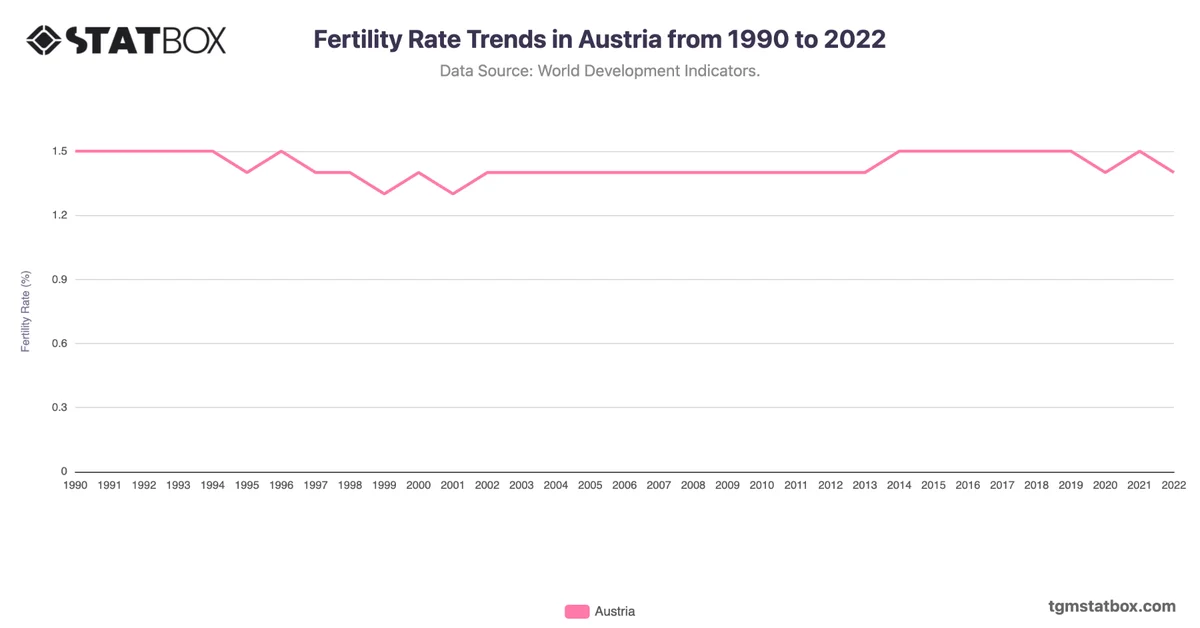
Find out more through related statistics on Austria’s annual GDP growth rate, Austria’s fertility rate trajectory, Austria’s military personnel share.