The "Population Growth Trends in Bangladesh from 1990 to 2023" chart shows a clear, gradual decline in growth rates over the past three decades, reflecting Bangladesh’s demographic transition and efforts in population management.
In 1990, the growth rate was relatively high at 2.1%, supported by a young population and high fertility rates. However, as family planning initiatives and access to healthcare expanded, the growth rate declined steadily in the early 1990s, reaching 1.8% by 1992. Throughout the late 1990s and early 2000s, growth rates stabilized around 1.9%, as Bangladesh’s economy and social infrastructure adapted to support a more balanced population.
A sharper decline began in the mid-2000s, with growth rates falling to 1.1% by 2007, reflecting successful family planning policies and increased urbanization, where smaller family sizes are more common. After some fluctuations around 1.2% in the 2010s, growth rates settled at 1.1% by 2020, and a slight further decline led to a 1.0% rate in 2023.
This downward trend reflects Bangladesh’s continued focus on sustainable population growth, with improvements in education and economic opportunities playing a critical role.
In 1990, the growth rate was relatively high at 2.1%, supported by a young population and high fertility rates. However, as family planning initiatives and access to healthcare expanded, the growth rate declined steadily in the early 1990s, reaching 1.8% by 1992. Throughout the late 1990s and early 2000s, growth rates stabilized around 1.9%, as Bangladesh’s economy and social infrastructure adapted to support a more balanced population.
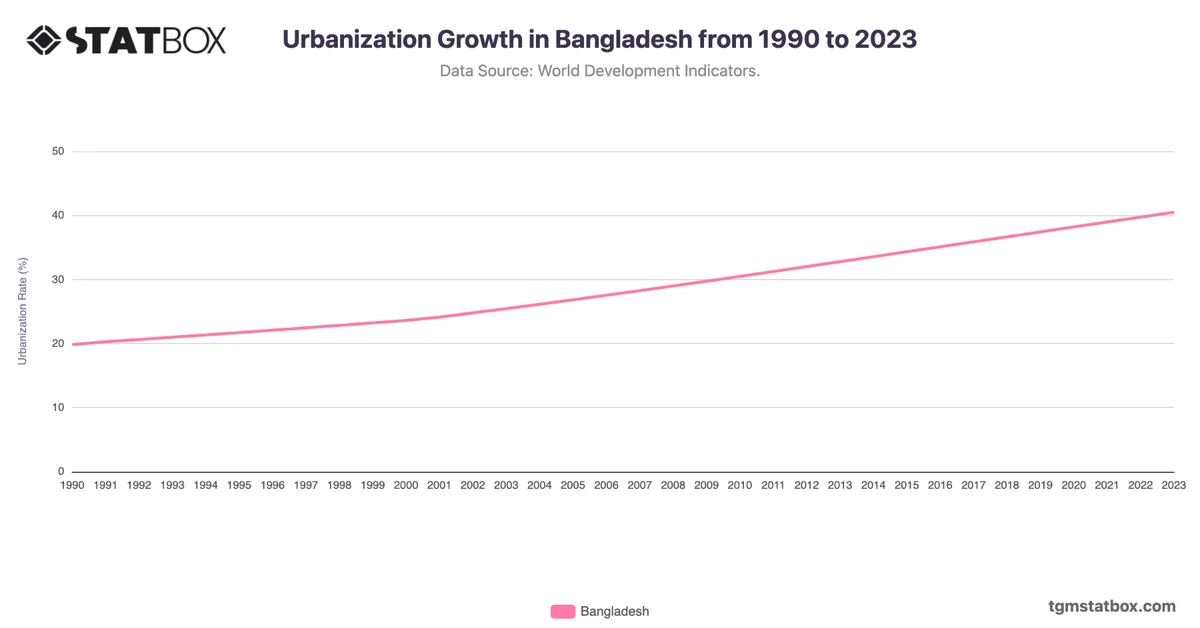
A sharper decline began in the mid-2000s, with growth rates falling to 1.1% by 2007, reflecting successful family planning policies and increased urbanization, where smaller family sizes are more common. After some fluctuations around 1.2% in the 2010s, growth rates settled at 1.1% by 2020, and a slight further decline led to a 1.0% rate in 2023.
This downward trend reflects Bangladesh’s continued focus on sustainable population growth, with improvements in education and economic opportunities playing a critical role.
Find out more through related statistics on Bangladesh’s annual GDP growth rate, Bangladesh’s changing mortality rate, Urbanization rate in Bangladesh.