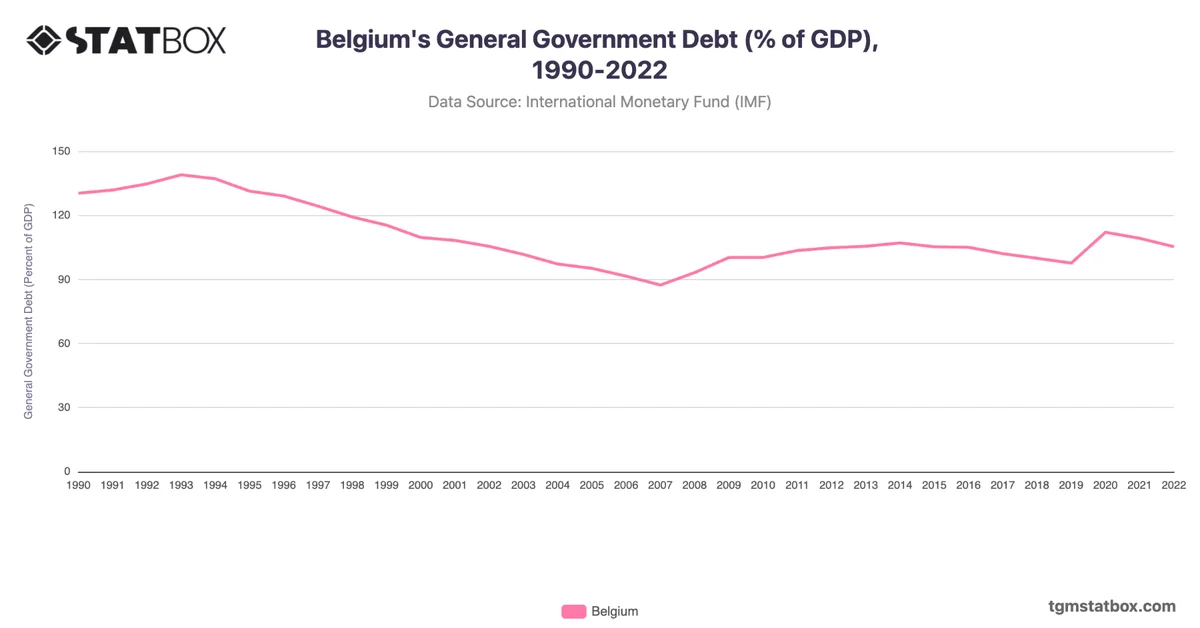
Belgium's central government debt exhibited a high initial burden, surpassing 100% of GDP throughout the 1990s, peaking at 116.61% in 1995. Economic stagnation and fiscal deficits contributed to this rise. However, comprehensive fiscal reforms and economic recovery enabled a consistent decline, reducing the ratio to 77.2% by 2007.
The global financial crisis of 2008 reversed this trend, with debt increasing to 93.55% in 2020 amid pandemic-related expenditures. Belgium's subsequent economic recovery brought the ratio down to 86.62% by 2022, demonstrating fiscal resilience and a gradual return to pre-pandemic levels.
The global financial crisis of 2008 reversed this trend, with debt increasing to 93.55% in 2020 amid pandemic-related expenditures. Belgium's subsequent economic recovery brought the ratio down to 86.62% by 2022, demonstrating fiscal resilience and a gradual return to pre-pandemic levels.
For a broader context, visit other statistics on Belgium’s agricultural GDP share, Belgium’s public debt ratio, Belgium’s services sector share in GDP.