Belgium’s unemployment rate over the years mirrors its economic resilience amid periods of both growth and recession. The early 1990s saw fluctuations, with unemployment rates initially around 7.3% and climbing to 9.6% by 1994 due to structural adjustments. This was followed by a period of economic reforms aimed at curbing unemployment, leading to a gradual decline to 6.6% by 2000.
Following the global financial crisis in 2008, Belgium's unemployment rate saw another increase, peaking at 8.5% in the mid-2010s. However, Belgium managed to recover moderately, and by 2018, unemployment fell to 5.9%. The pandemic in 2020 drove up unemployment again to 6.3%, showing the impact of global disruption on Belgium's workforce. However, consistent efforts have brought the rate down to 5.5% by 2023.
Following the global financial crisis in 2008, Belgium's unemployment rate saw another increase, peaking at 8.5% in the mid-2010s. However, Belgium managed to recover moderately, and by 2018, unemployment fell to 5.9%. The pandemic in 2020 drove up unemployment again to 6.3%, showing the impact of global disruption on Belgium's workforce. However, consistent efforts have brought the rate down to 5.5% by 2023.
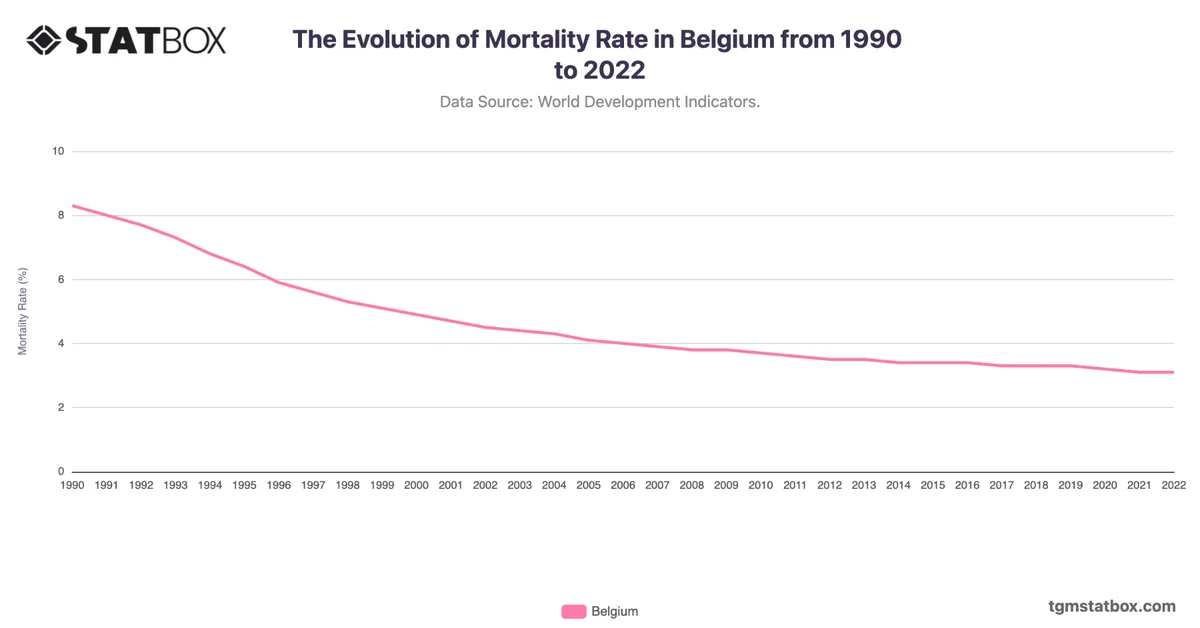
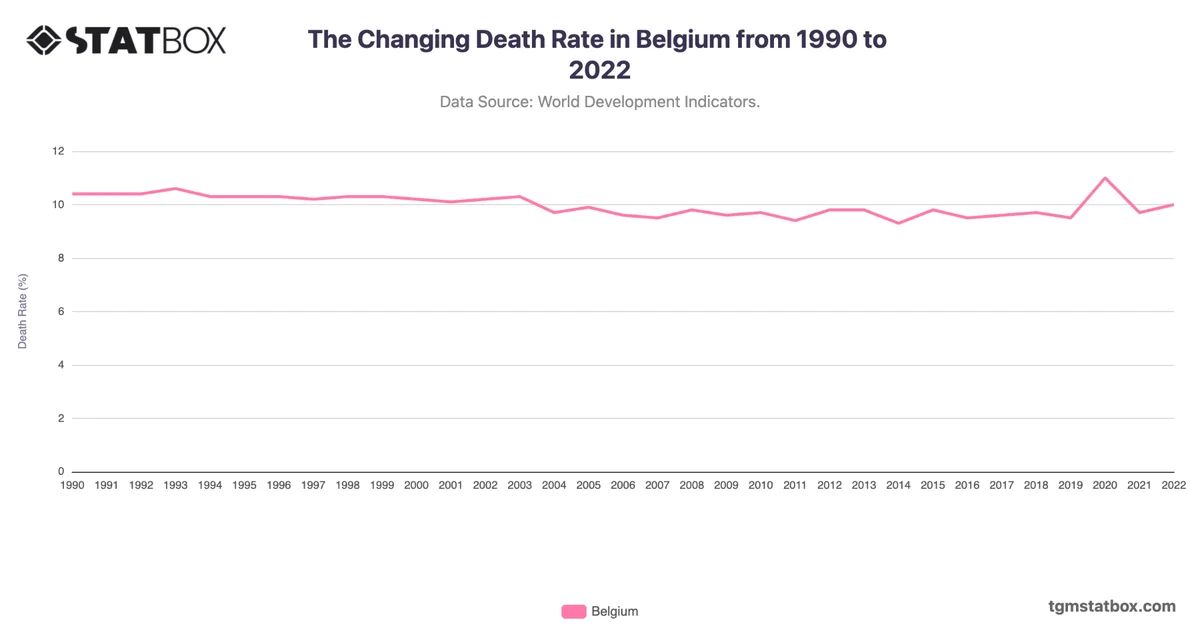
For a broader context, visit other statistics on Belgium’s working-age population share, Belgium’s mortality rate changes, Belgium’s mortality rate.