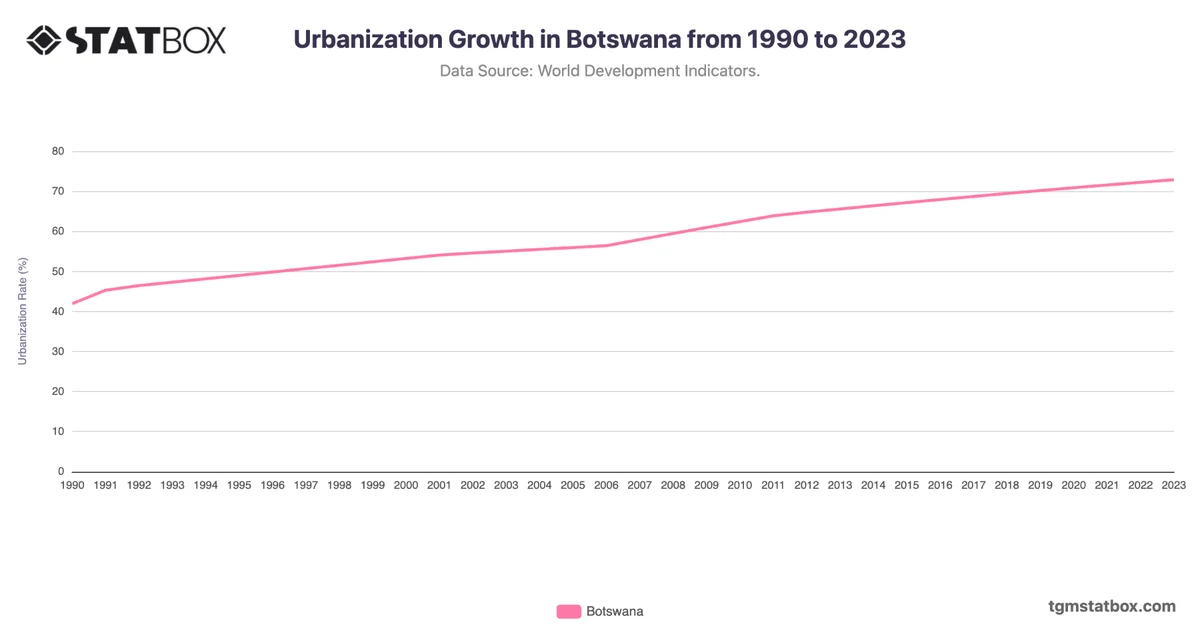
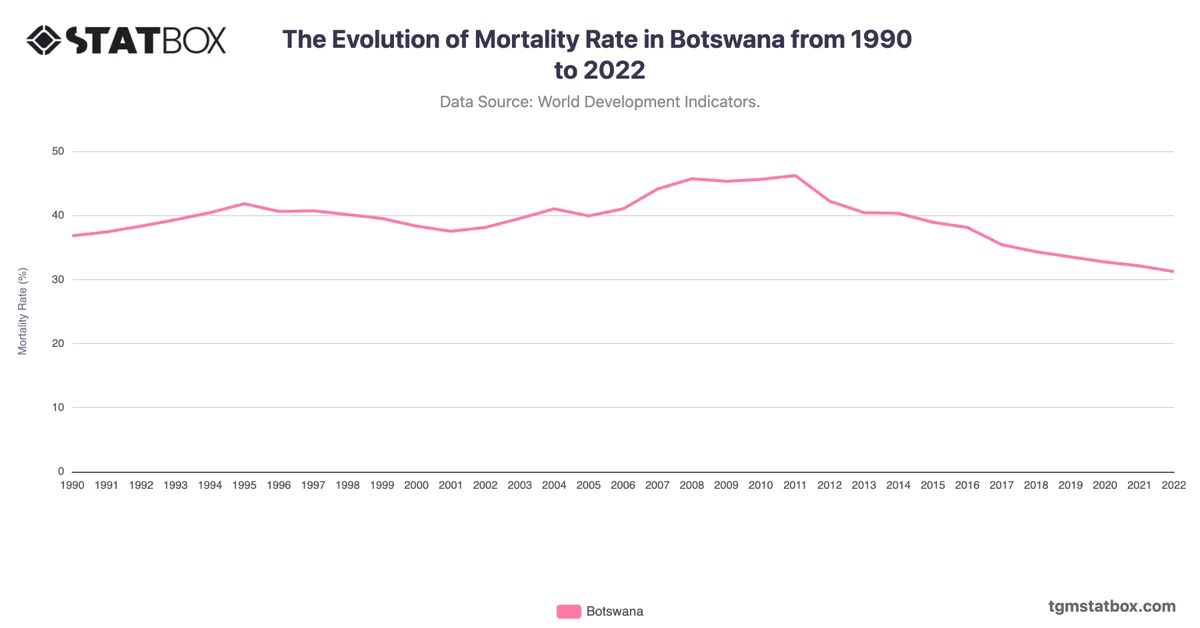
The chart reflects Botswana’s demographic journey from high growth in the early 1990s to a more moderated rate in recent years. In 1990, Botswana’s growth rate was notably high at 3.0%, gradually declining throughout the decade as the country faced the impact of the HIV/AIDS epidemic, which significantly affected population dynamics and life expectancy. By 1999, growth slowed to 2.1%, reflecting these health challenges alongside evolving population policies.
The early 2000s saw stabilization, with rates fluctuating between 1.7% and 2.1%, influenced by improved healthcare responses and a growing emphasis on population health. Post-2010, growth remained steady around 2.0%, supported by economic development and healthcare improvements. However, since 2021, the rate slightly decreased to 1.6%, likely due to continued health challenges and an aging population. These trends highlight Botswana's progress in health interventions but underscore ongoing demographic challenges, with implications for workforce planning, healthcare, and sustainable development policies.
The early 2000s saw stabilization, with rates fluctuating between 1.7% and 2.1%, influenced by improved healthcare responses and a growing emphasis on population health. Post-2010, growth remained steady around 2.0%, supported by economic development and healthcare improvements. However, since 2021, the rate slightly decreased to 1.6%, likely due to continued health challenges and an aging population. These trends highlight Botswana's progress in health interventions but underscore ongoing demographic challenges, with implications for workforce planning, healthcare, and sustainable development policies.
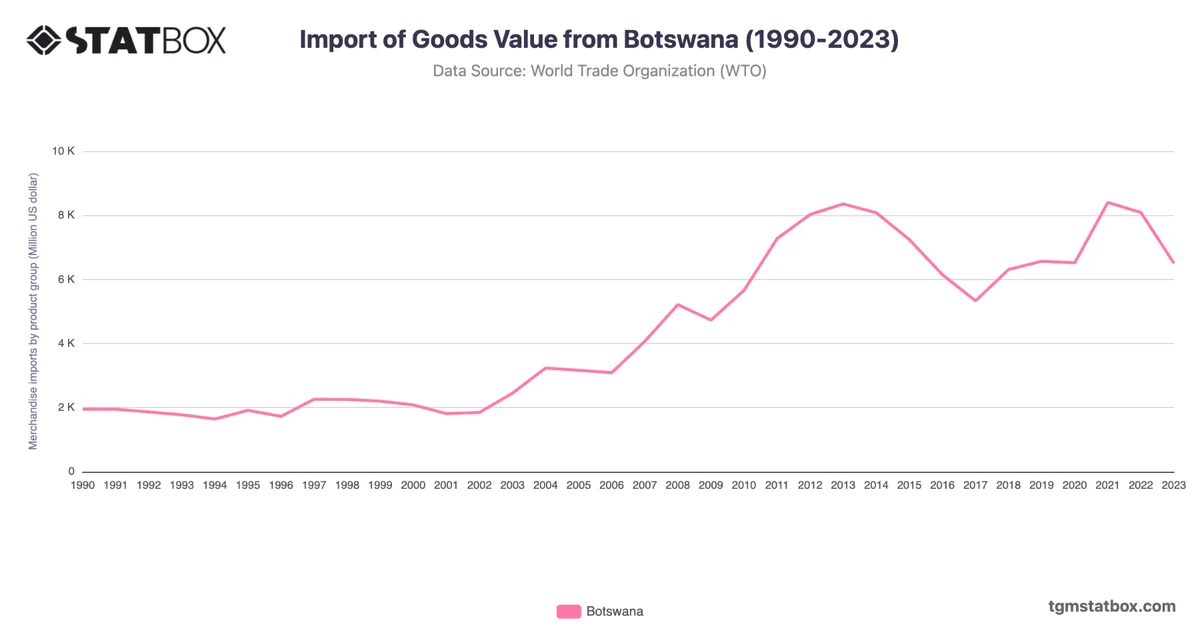
Gain a broader perspective by reviewing Botswana’s fertility rate, military personnel-to-population ratio in Botswana, Botswana’s import value.