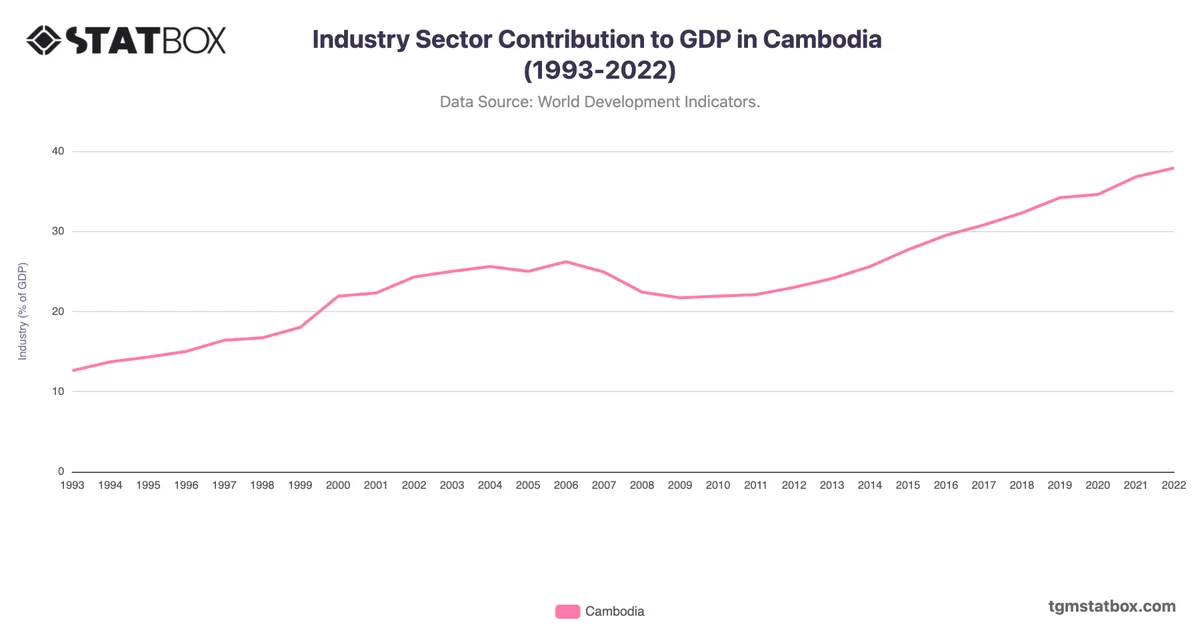
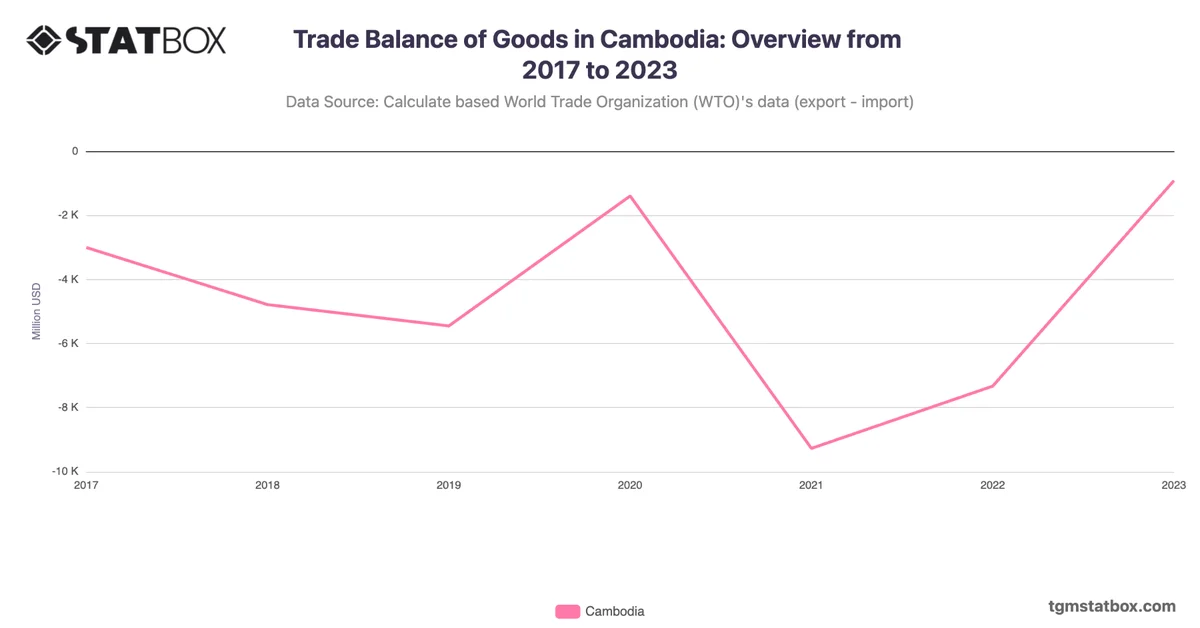
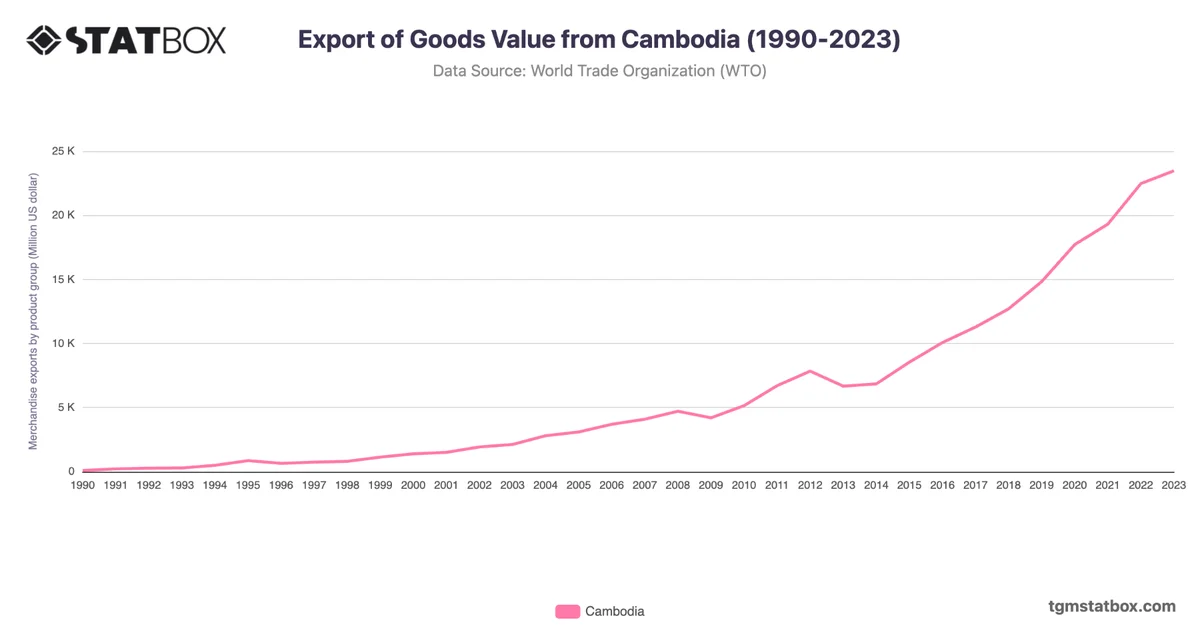
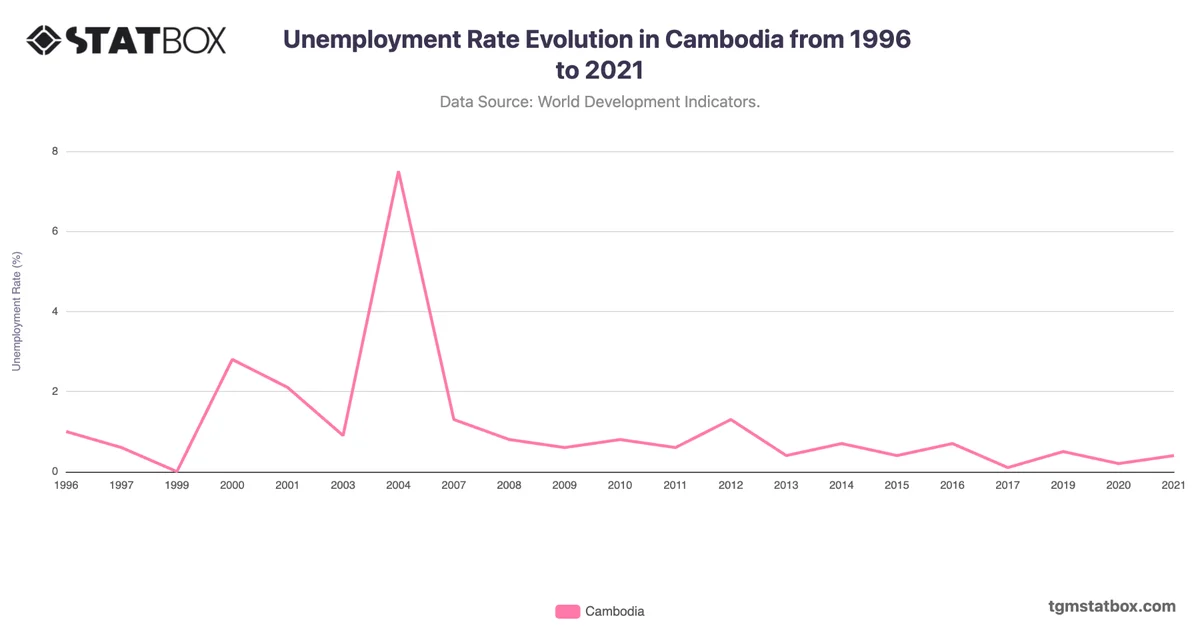
Cambodia's imports skyrocketed from $164M in 1990 to $6.5B in 2008, driven by post-conflict reconstruction and its integration into ASEAN. A minor setback during the global financial crisis was followed by rapid growth, with imports reaching $17.5B in 2018, reflecting expanding consumer markets and industrialization.
The record $29.8B in 2022 aligns with increased foreign investments and infrastructure projects. A drop to $24.3B in 2023 indicates global economic adjustments. Cambodia’s import trends underline its transition into a fast-developing economy reliant on machinery, raw materials, and consumer goods imports.
The record $29.8B in 2022 aligns with increased foreign investments and infrastructure projects. A drop to $24.3B in 2023 indicates global economic adjustments. Cambodia’s import trends underline its transition into a fast-developing economy reliant on machinery, raw materials, and consumer goods imports.
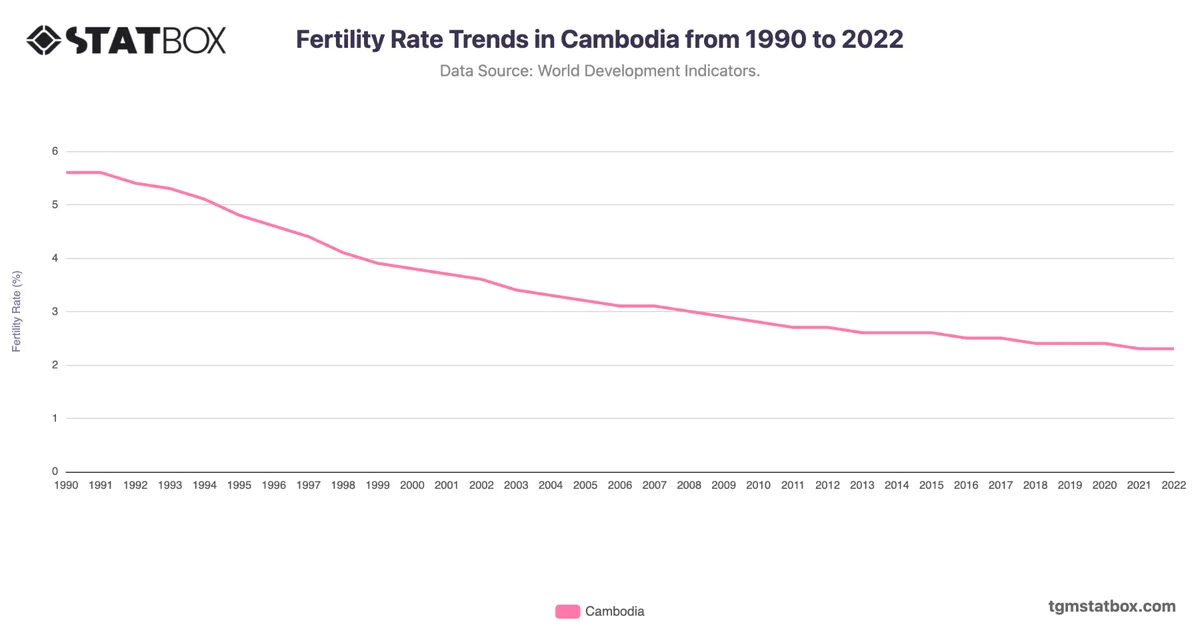
Discover additional trends and data on Cambodia’s fertility rate trends, Cambodia’s annual GDP growth rate, Cambodia’s agriculture contribution to GDP.