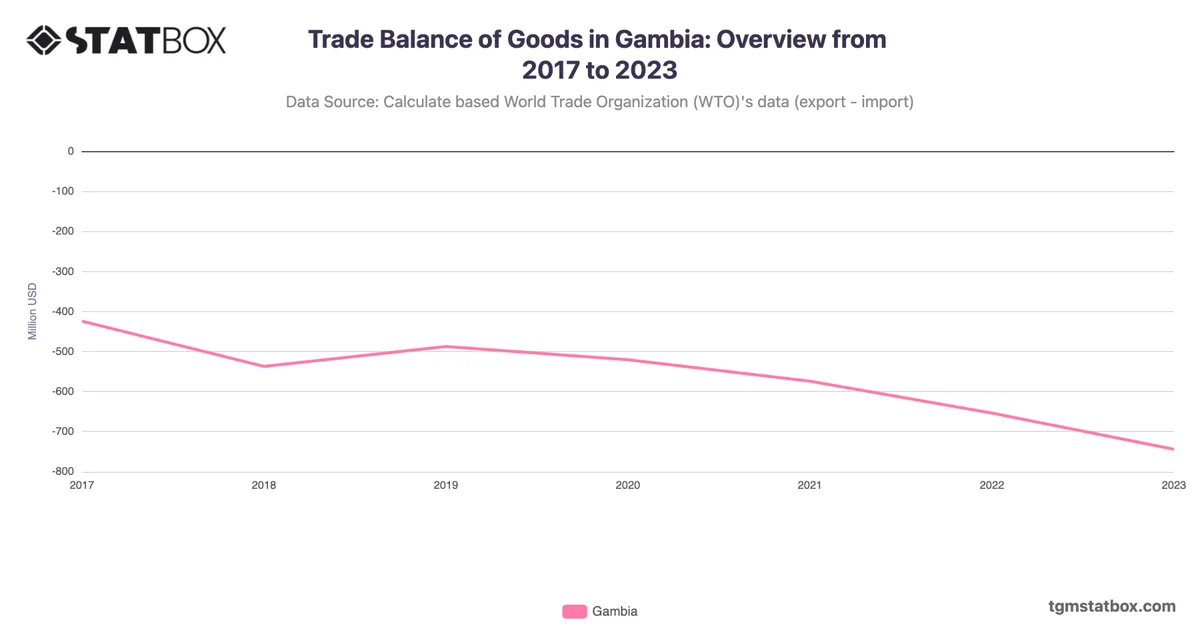
The Gambia’s imports rose from $188M in 1990 to $1.2B in 2023, reflecting gradual economic growth and trade liberalization. Steady increases from $229M in 2004 to $677M in 2018 correspond with investments in infrastructure and growing consumer markets.
The sharp rise to $1.2B in 2023 highlights increased reliance on imports for industrial and agricultural inputs. The Gambia’s import trends emphasize its small but growing economy and the importance of international trade in supporting development efforts.
The sharp rise to $1.2B in 2023 highlights increased reliance on imports for industrial and agricultural inputs. The Gambia’s import trends emphasize its small but growing economy and the importance of international trade in supporting development efforts.
For additional information, visit statistics on Gambia’s yearly GDP, Gambia’s industry sector GDP share, Gambia’s median age shift.