Chile's import growth reflects its trade-oriented economy, with values rising from $7.9B in 1990 to $104.6B in 2022. Key growth phases, like the sharp increase from $32.7B in 2005 to $62.7B in 2008, align with the commodities boom, boosting income and consumer demand.
The 2009 decline to $42.8B due to the global financial crisis was followed by a recovery phase, peaking in 2022. However, a drop to $85.3B in 2023 indicates global economic pressures and local policy adjustments. Chile’s import trends highlight its dependency on raw materials and capital goods for its mining and industrial sectors.
The 2009 decline to $42.8B due to the global financial crisis was followed by a recovery phase, peaking in 2022. However, a drop to $85.3B in 2023 indicates global economic pressures and local policy adjustments. Chile’s import trends highlight its dependency on raw materials and capital goods for its mining and industrial sectors.
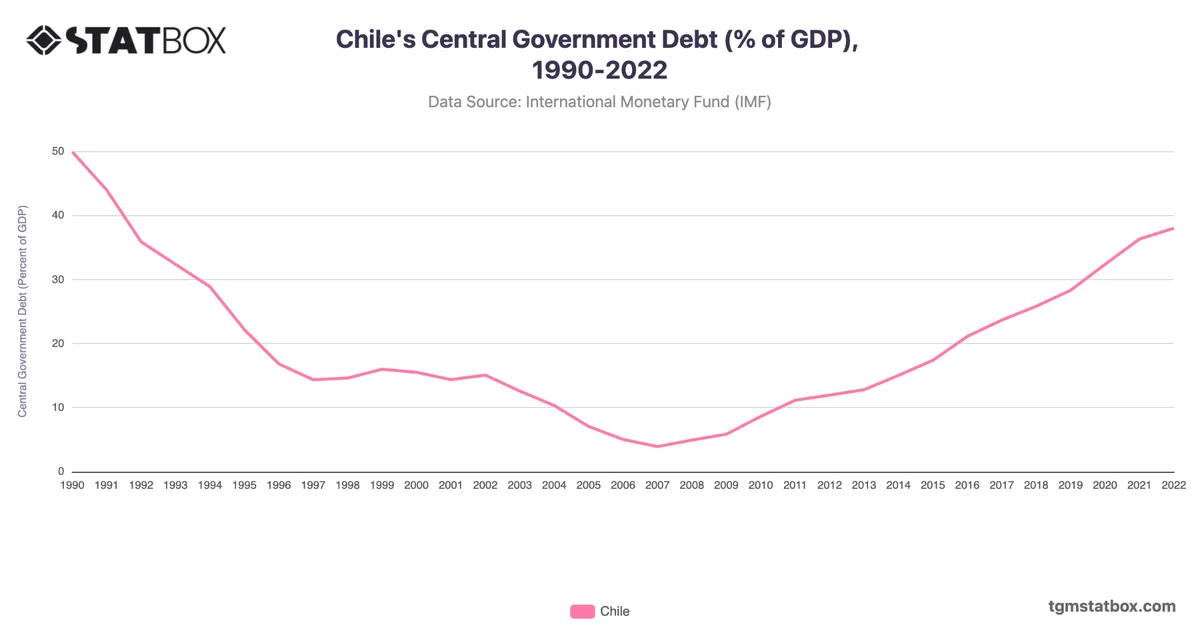
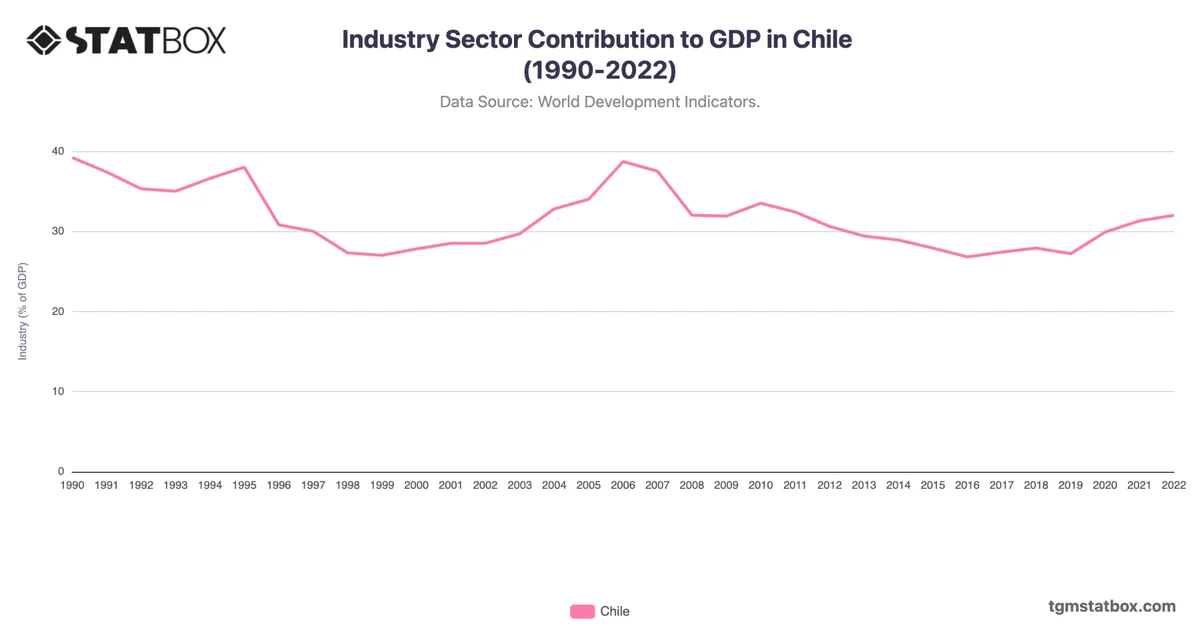
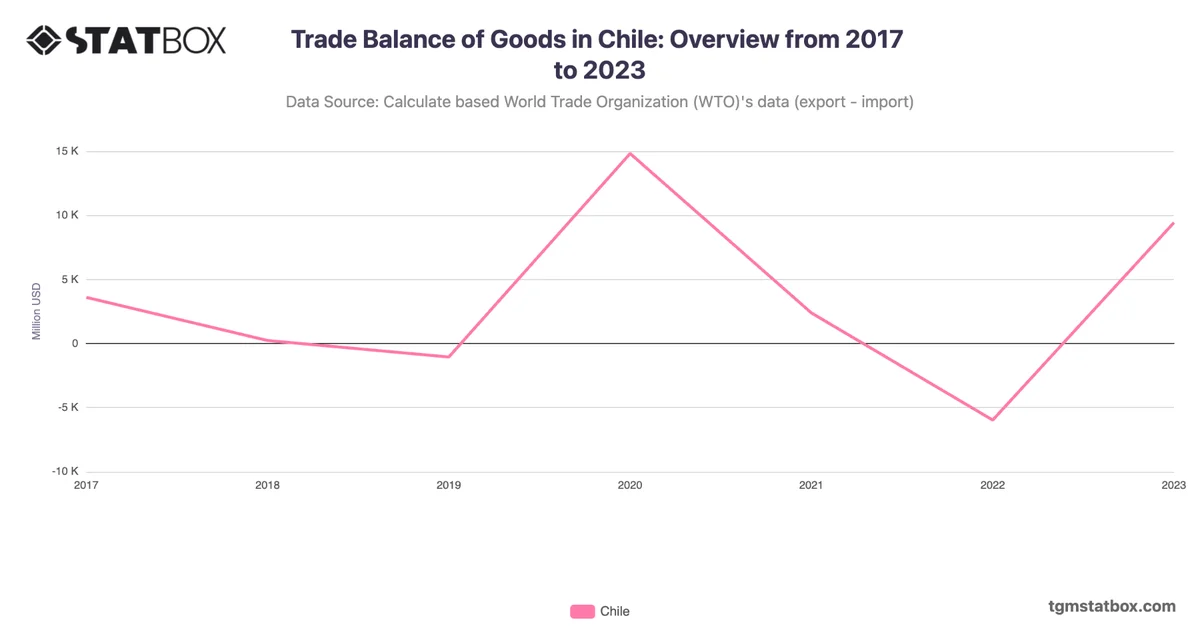
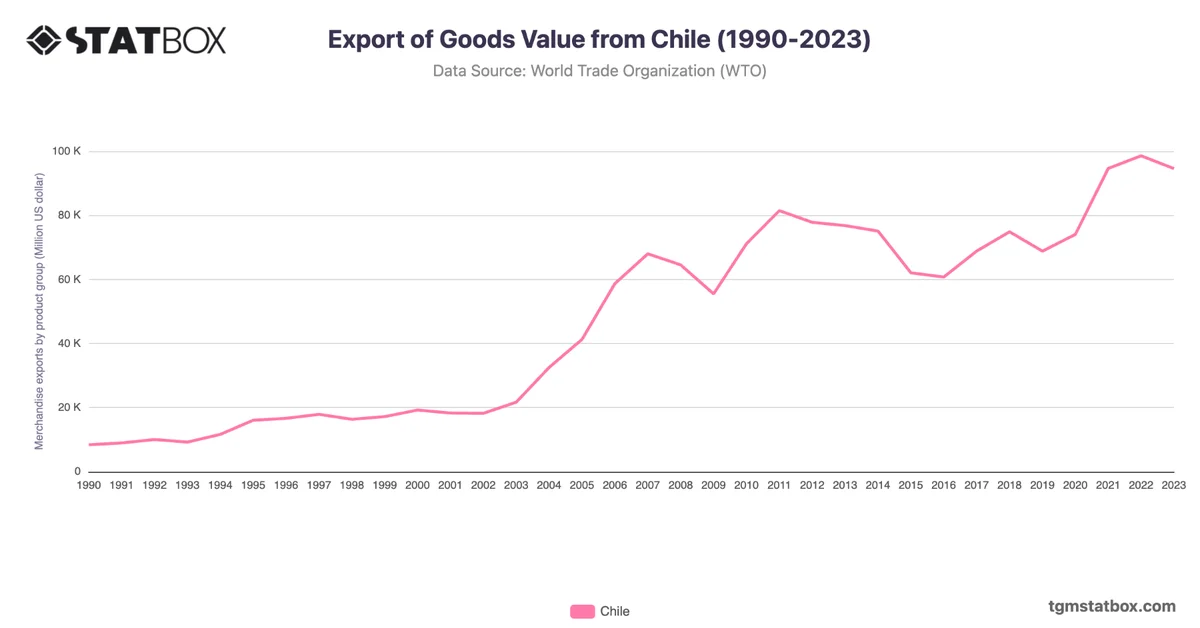
Find out more through related statistics on Industry sector’s GDP share in Chile, Chile’s annual GDP figures, Chile’s goods trade balance.