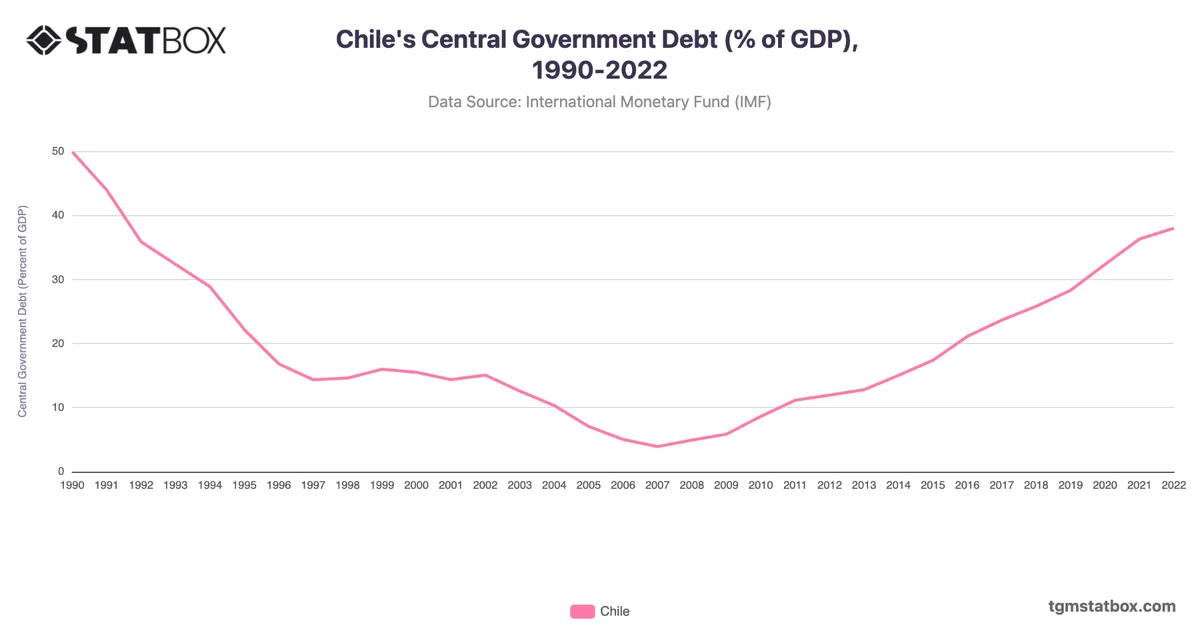
Chile’s government debt as a percentage of GDP displayed a strong downward trend from 1990, when it was 43.1%, reaching its lowest level at 3.9% in 2007. This reduction was primarily due to a combination of economic reforms, fiscal discipline, and a commodities boom that boosted revenues from Chile’s copper exports. The global financial crisis in 2008 led to a temporary increase in debt to 4.9% in 2008 and 5.8% in 2009, as the government adopted stimulus measures to support the economy. However, Chile's debt levels remained relatively low due to sound fiscal policies.
In the years following 2010, debt levels gradually increased, reaching 15.0% in 2014 and then rising steadily to 38.0% by 2022. This trend reflects the impact of slower economic growth, increased social spending, and fiscal policies aimed at addressing social inequality. The COVID-19 pandemic accelerated this debt increase, with the debt-to-GDP ratio jumping from 28.3% in 2019 to 32.4% in 2020 and continuing to grow. By 2022, government debt levels were higher than in previous decades but remained moderate by global standards, reflecting Chile's historical emphasis on fiscal stability.
In the years following 2010, debt levels gradually increased, reaching 15.0% in 2014 and then rising steadily to 38.0% by 2022. This trend reflects the impact of slower economic growth, increased social spending, and fiscal policies aimed at addressing social inequality. The COVID-19 pandemic accelerated this debt increase, with the debt-to-GDP ratio jumping from 28.3% in 2019 to 32.4% in 2020 and continuing to grow. By 2022, government debt levels were higher than in previous decades but remained moderate by global standards, reflecting Chile's historical emphasis on fiscal stability.
Discover additional trends and data on Chile’s annual GDP growth rate, Chile’s manufacturing contribution to GDP, Chile’s import value.