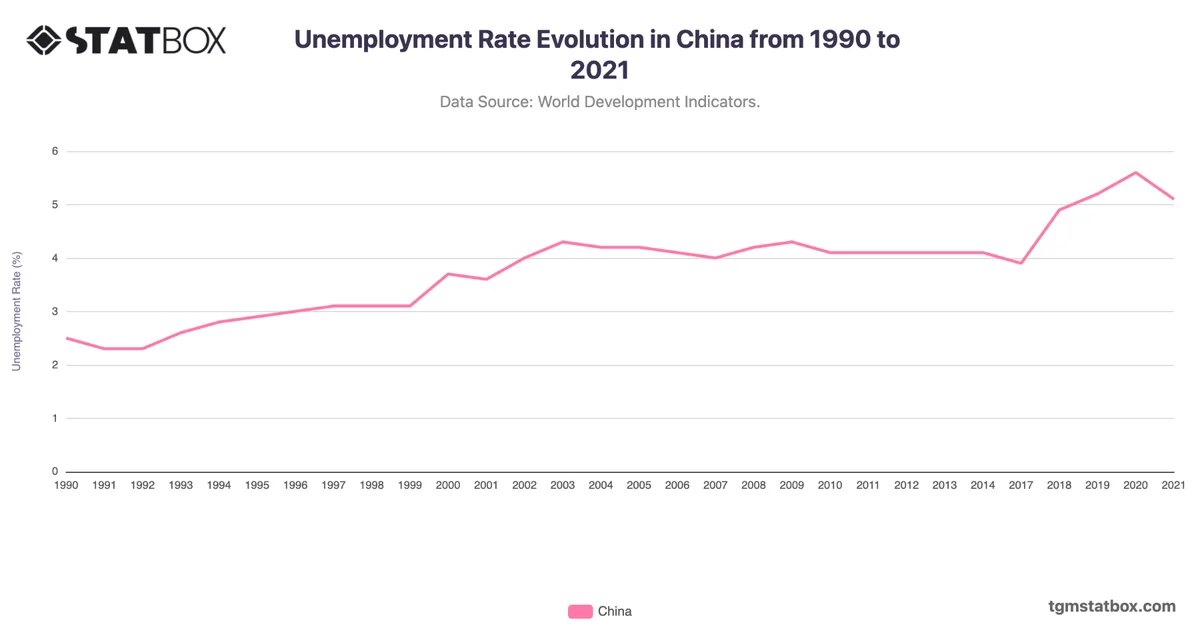
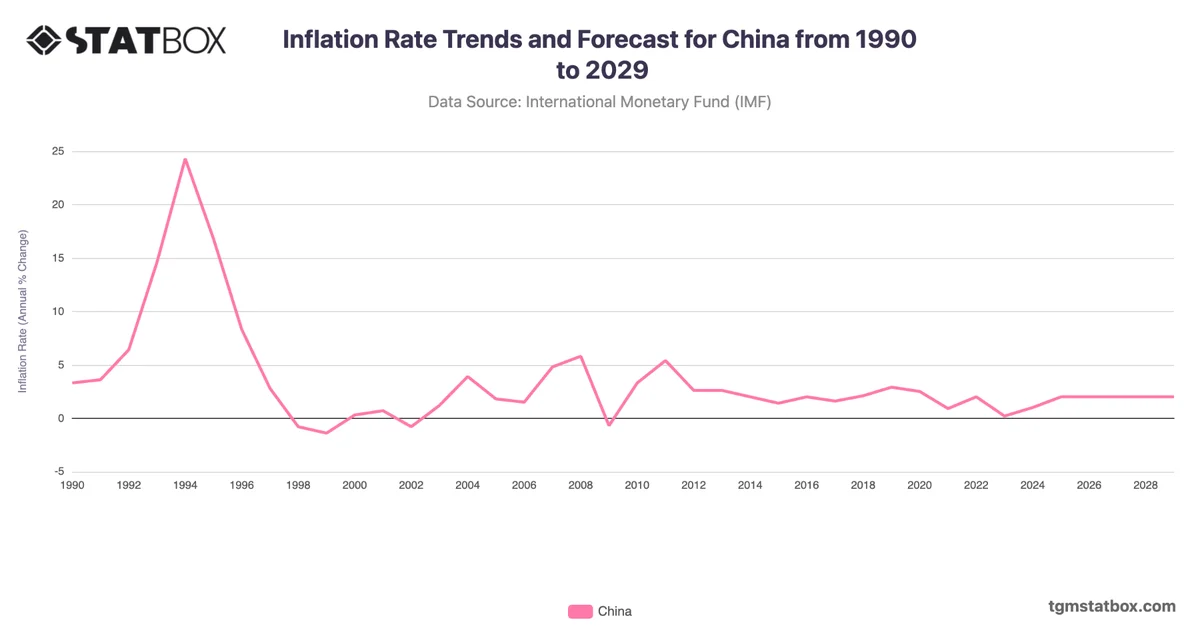
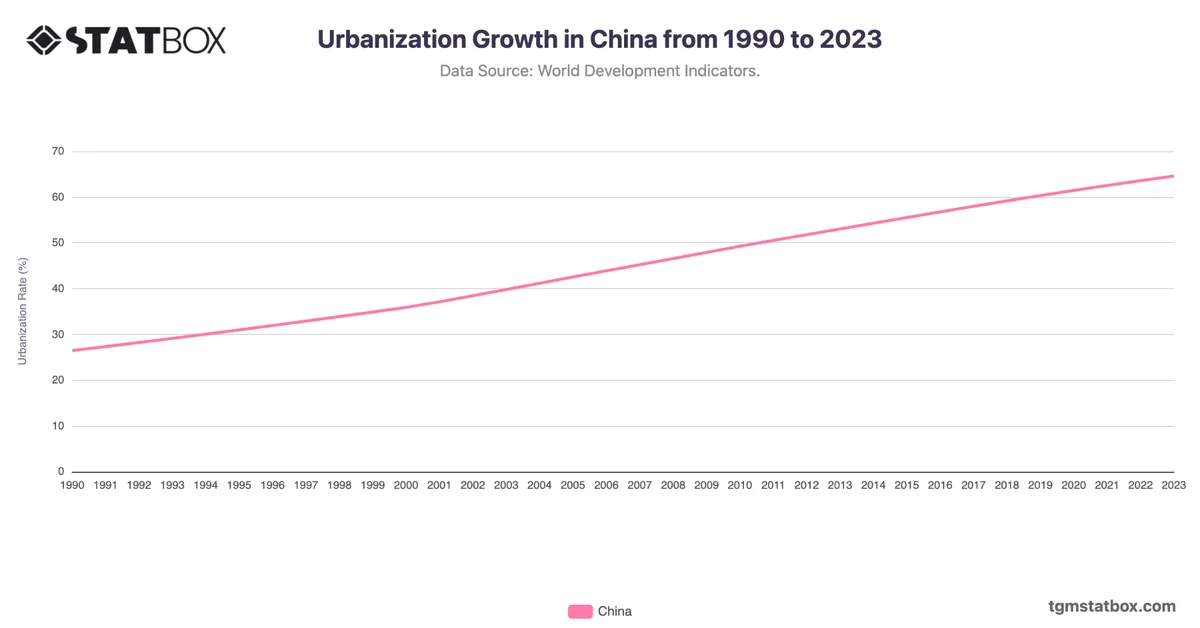
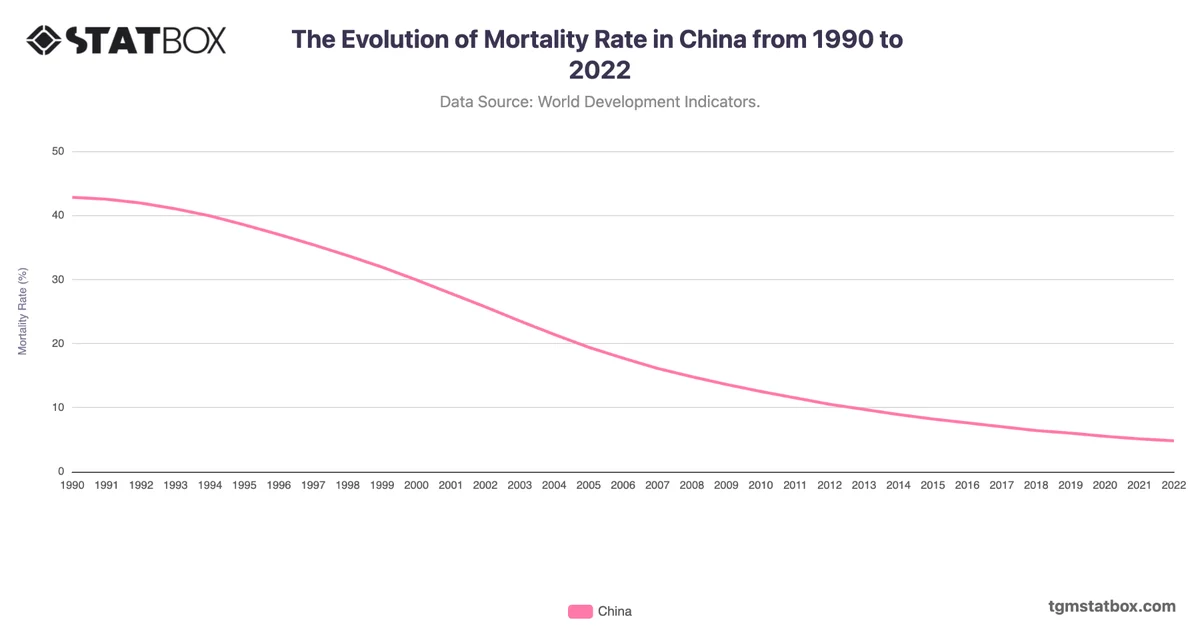
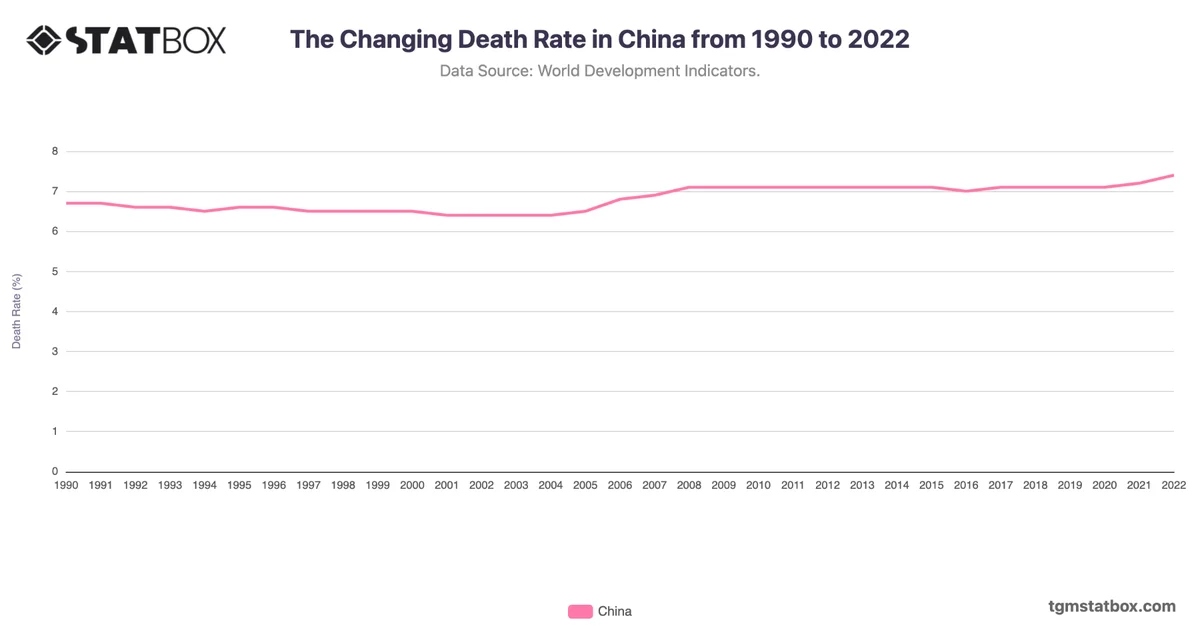
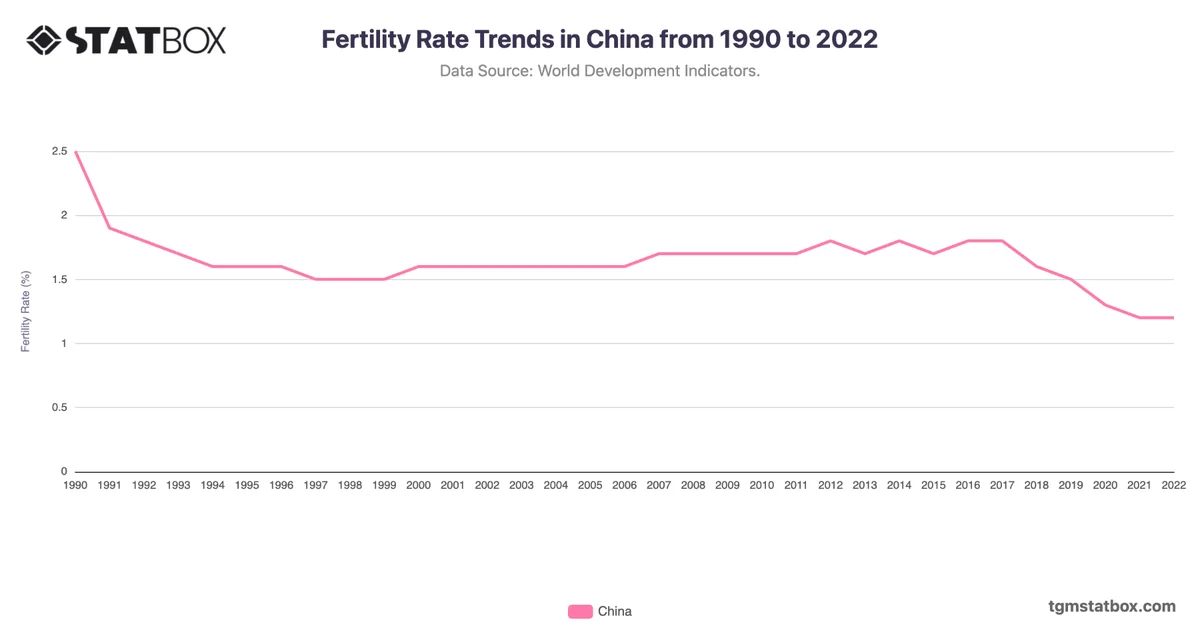
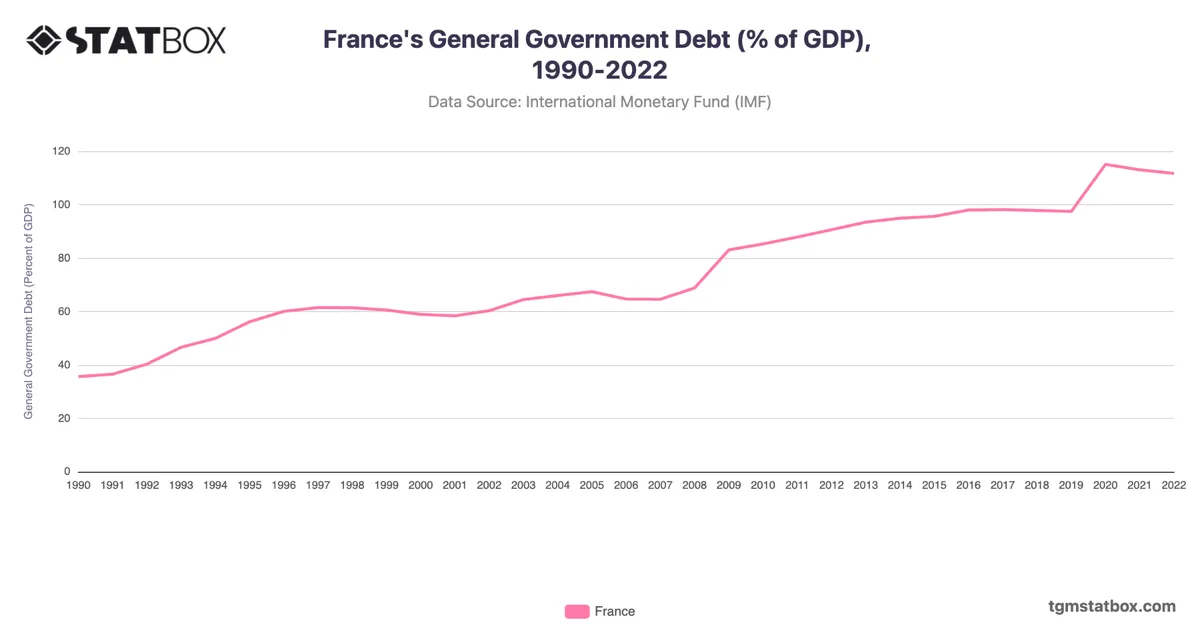
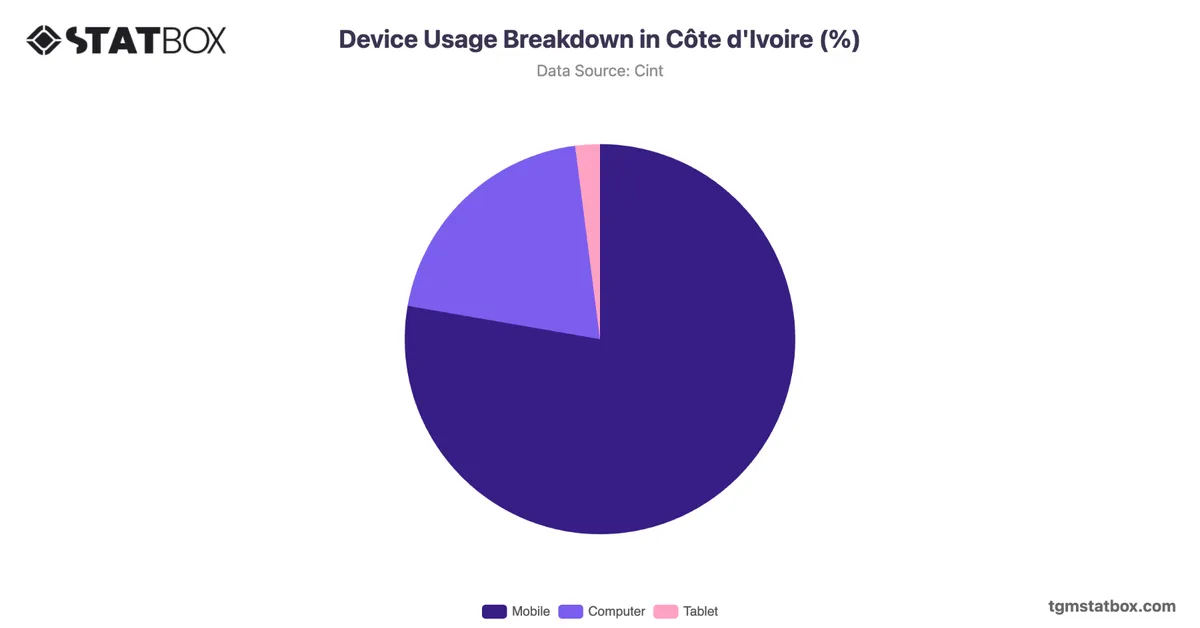
In 2023, China's GDP growth rate was reported at 5.2%. The country has demonstrated remarkable economic resilience and adaptability, despite facing various challenges over the decades. From a historical perspective, China’s economy has undergone significant transformations since the early 1960s.
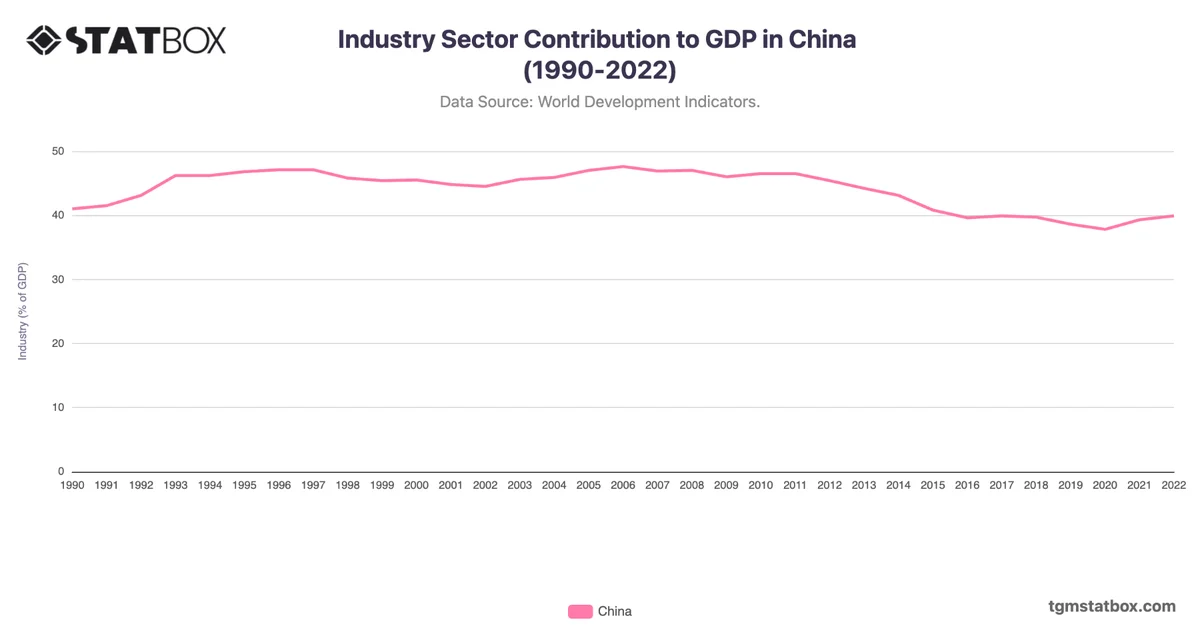
The 1978 economic reforms marked a pivotal shift, transitioning from a centrally planned economy to a more market-oriented approach. This change facilitated foreign investments, technological advancements, and the rise of the private sector, leading to unprecedented growth rates. The structural changes in the economy, with a gradual move from agriculture to industry and services, have been crucial. The service sector's contribution to GDP has expanded significantly, reflecting a mature economic landscape.
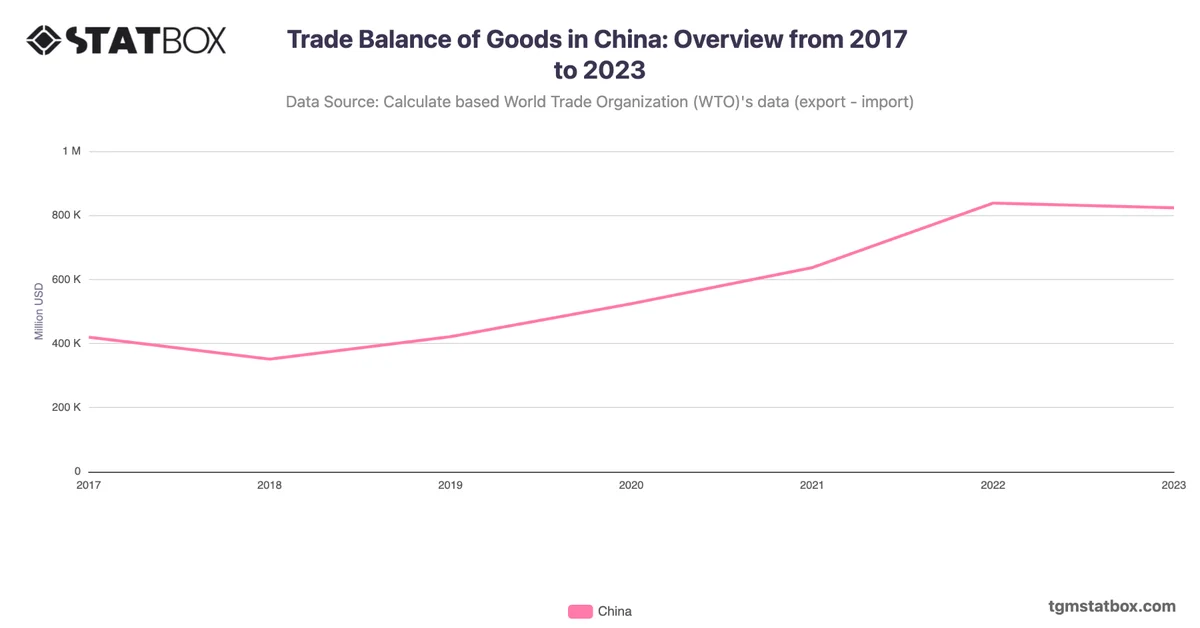
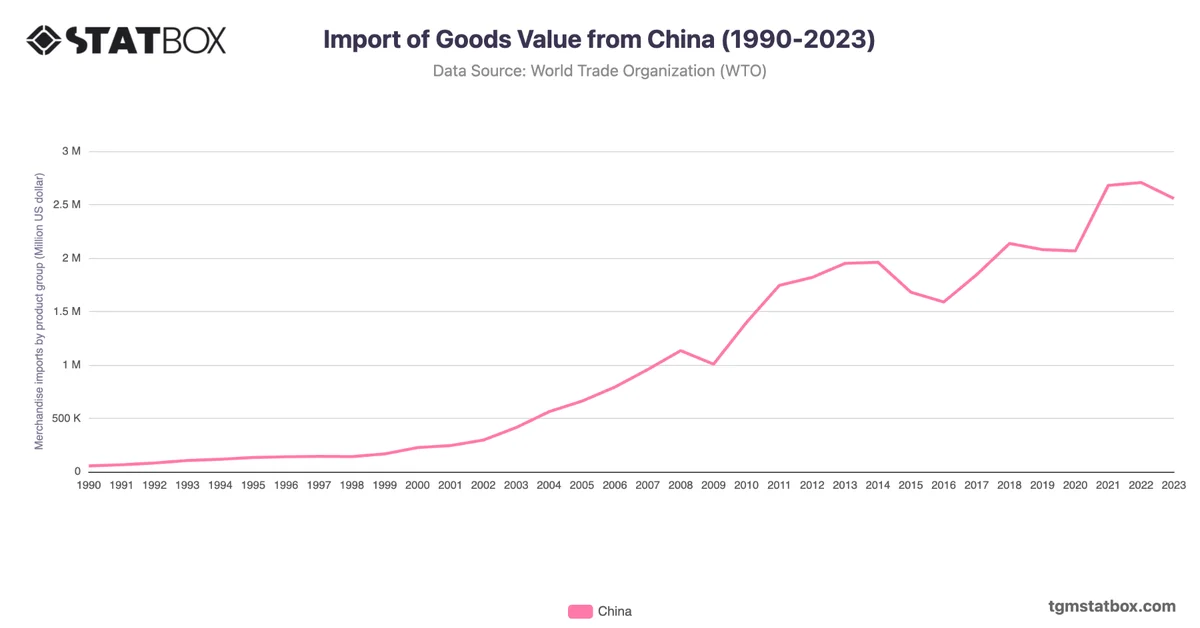
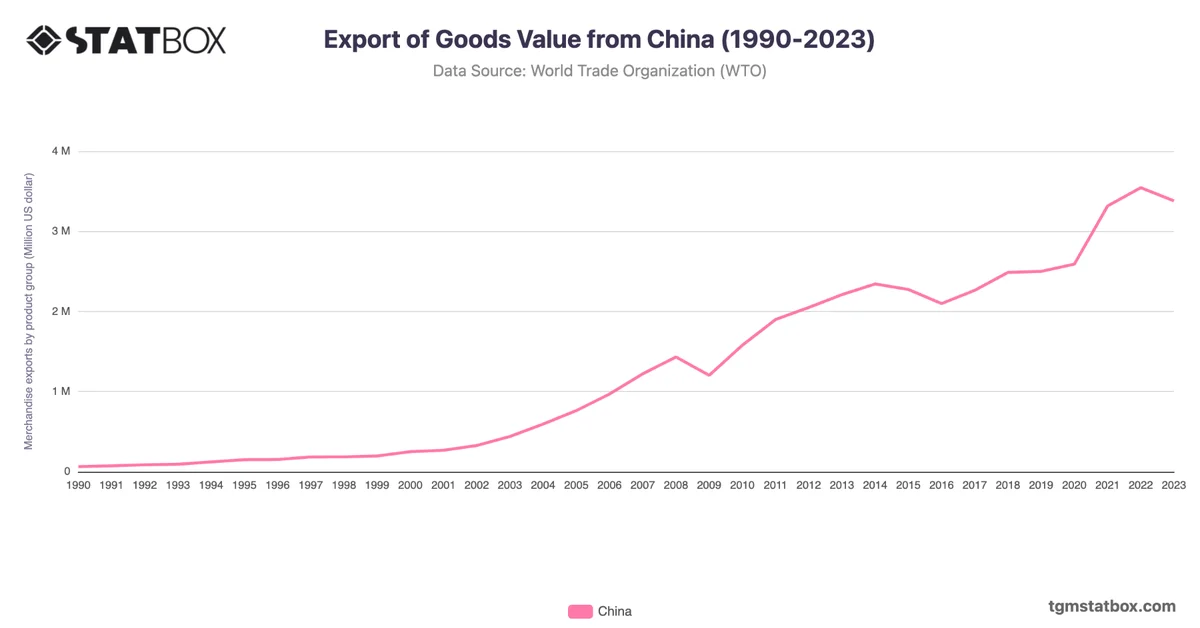
Trade dynamics also play a vital role in China’s GDP growth. With its manufacturing prowess, China has maintained a strong trade surplus, bolstered by robust exports and a growing domestic market. This trade relationship has positioned China as a global economic powerhouse. However, the economy has faced headwinds, including the COVID-19 pandemic, which temporarily disrupted growth in 2020, leading to a contraction of 2.2%. Despite this, the recovery in subsequent years underscores the underlying strengths of the Chinese economy.
Furthermore, factors such as government policies, infrastructure investments, and demographic shifts significantly influence GDP growth. China’s focus on sustainable development and technological innovation is expected to shape its economic trajectory in the coming years, making it essential to monitor these indicators for future growth patterns.
Gain a broader perspective by reviewing China’s industry sector share in GDP, China’s population count, Agriculture sector’s share in China’s GDP.