Device Concentration Patterns Among Online Fashion Shoppers in Vietnam
The device through which a consumer accesses an online retail environment can meaningfully influence the browsing experience, purchase journey, and overall engagement with fashion products. In Vietnam, the mix of devices available to consumers and their preferences for specific platforms shapes how online fashion shopping is conducted across different contexts and occasions.
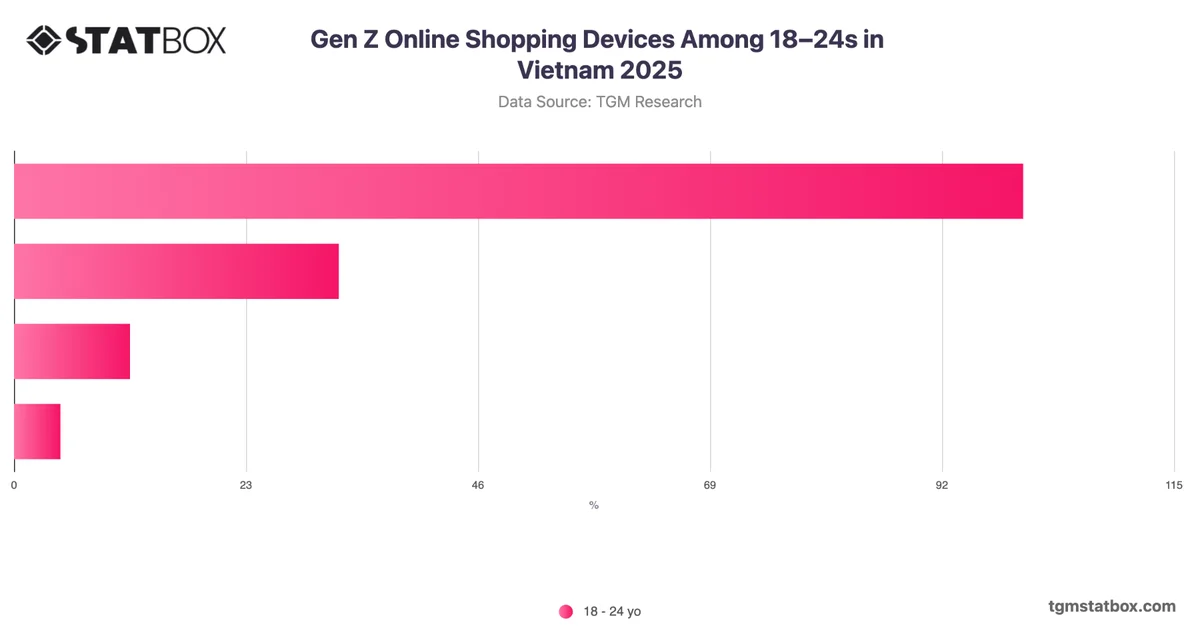
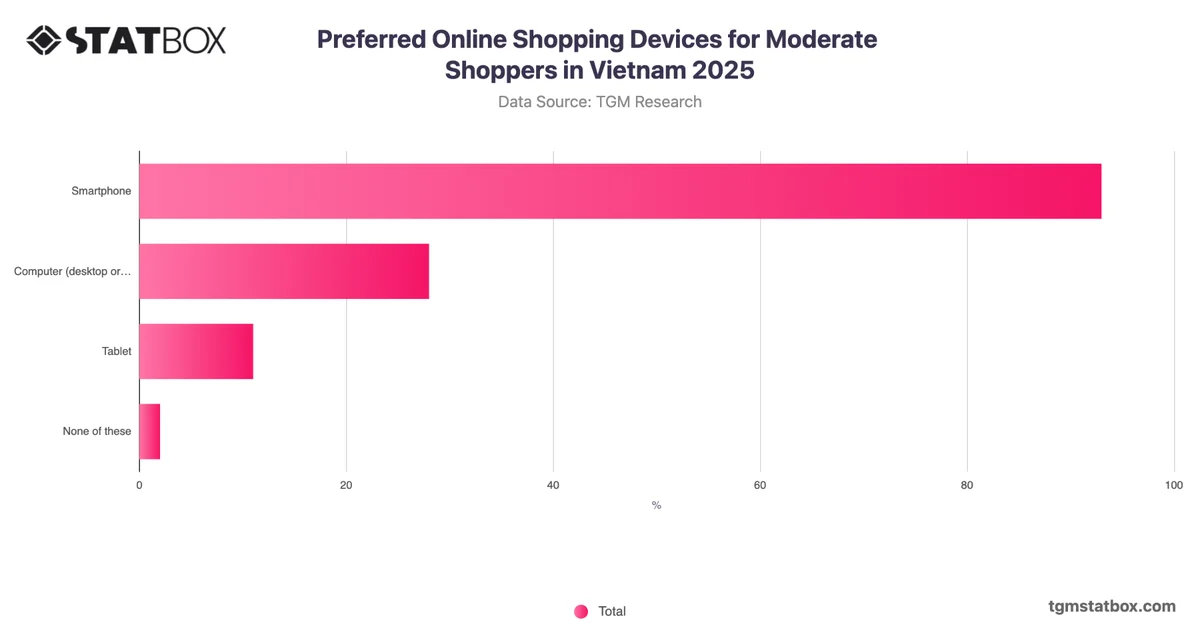
The defining characteristic of online fashion shopping device usage in Vietnam in 2025 is the overwhelming concentration around a single channel. Smartphones account for 94% of online fashion purchases, a figure that stands in stark contrast to computers at 30% and tablets at just 11%. This near-exclusive reliance on smartphones among fashion shoppers suggests that mobile is not simply a preferred option but the de facto standard for accessing fashion products online. The 64-percentage-point gap between smartphones and computers indicates that desktop browsing plays a supplementary rather than primary role in the online fashion shopping journey. For brands and retailers targeting fashion shoppers in Vietnam, this concentration points to the importance of prioritising mobile-first product presentation, checkout optimisation, and visual merchandising specifically calibrated for smaller screens and touch-based navigation.