Chart

Key Factors for Choosing Preferred Food Delivery App Globally 2024

Key Factors for Choosing Preferred Food Delivery App Globally 2024

Share the statistic on social media channels or embed the statistic in your website using "Embed Code", where available.

Share chart

Embed chart
Select Citation

Cite this statistic and select one of the following formats: APA, Chicago, Harvard, MLA & Bluebook


  • APA
  • Chicago
  • Harvard
  • MLA
  • Bluebook
  • IEEE
TGM StatBox. (2025). Key Factors for Choosing Preferred Food Delivery App Globally 2024. TGM StatBox.
Insights

Key Takeaways

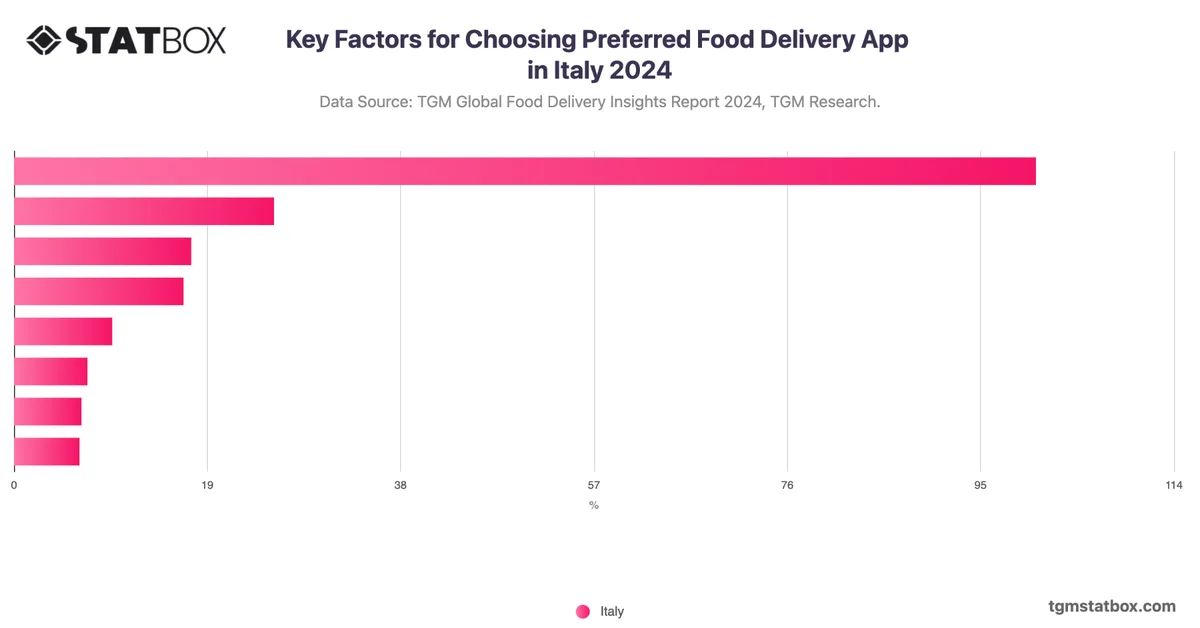
When it comes to why users choose their preferred food delivery app, brand trust is by far the leading factor globally, cited by 43.2% of users. Fast order acceptance and processing follow at 20.3%, while competitive pricing comes next at 9%. Features like a user-friendly interface, quick delivery times, and restaurant quality also play a role, though to a lesser extent. Overall, while pricing and convenience matter, users ultimately stick with platforms they trust to be reliable and consistent.
AI-powered chart insight: This summary is automatically generated to help you understand the chart at a glance. It is intended as an overview; view the full chart and underlying data for complete context.

Related report

Would You Like to Know More?
Explore Our Food Delivery Report

Charts library

Further Recommended Food Delivery Statistics

Statbox vector
The briefing
New data, in your inbox

Consumer insights, data stories and product updates as we publish them. No other mail, and one click to leave.

Roughly two emails a month.

Research services
Have a question our newsroom hasn't answered? Ask it directly.

Our team can run the study behind the story — in 60+ countries, on your question, with the data belonging to you.