Share the statistic on social media channels or embed the statistic in your website using "Embed Code", where available.
Share chart
Embed chart Embed copied!Cite this statistic and select one of the following formats: APA, Chicago, Harvard, MLA & Bluebook
"How often do you use food delivery app?"
Key Takeaways
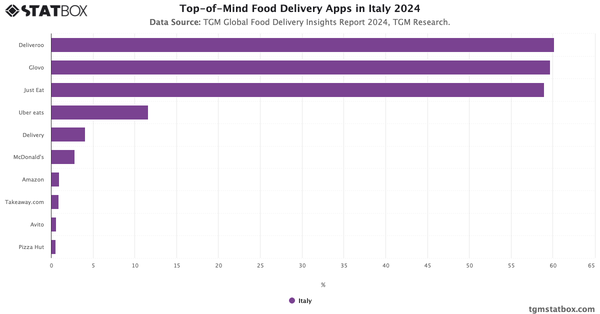
Compared to other regions, Europe shows more moderate food delivery app usage. While 44.8% of Europeans use these services at least once a week, this is notably lower than in regions like LATAM and APAC markets such as Vietnam and Thailand, where weekly usage exceeds 80%.

Food Delivery Insights Report in Europe
Learn more about Food Delivery in Europe with TGM StatBox. Explore our detailed report, complete with graphs and tables, for in-depth insights.
Go to report


Connect with our expert team for immediate assistance or comprehensive market analysis. We are always ready to support your business needs.