Share the statistic on social media channels or embed the statistic in your website using "Embed Code", where available.
Share chart
Embed chart Embed copied!Cite this statistic and select one of the following formats: APA, Chicago, Harvard, MLA & Bluebook
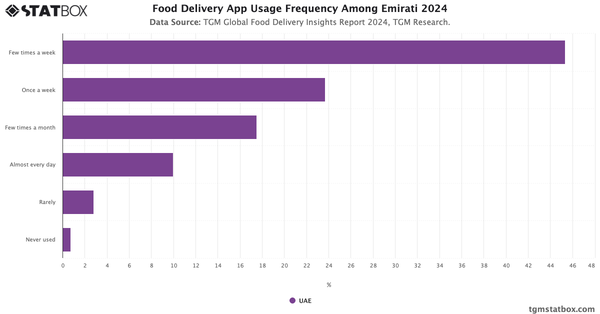
"How often do you use food delivery app?"
Key Takeaways
In South Africa, food delivery app usage is consistent but generally more occasional compared to some other regions. Around 48.5% of respondents use food delivery apps at least once a week. There is also a large group who order a few times a month (38.6%), showing that for many, food delivery serves as a convenience-based option rather than a daily routine. This pattern reflects a balanced approach to usage—valuing the service for its practicality without heavy dependence.

Food Delivery Insights Report in South Africa
Learn more about Food Delivery in South Africa with TGM StatBox. Explore our detailed report, complete with graphs and tables, for in-depth insights.
Go to report


Connect with our expert team for immediate assistance or comprehensive market analysis. We are always ready to support your business needs.