Indonesia’s unemployment rate saw a gradual increase in the early 1990s, rising from 2.5% in 1990 to 6.4% in 1999, largely driven by the Asian Financial Crisis, which severely impacted economic stability. The early 2000s continued this trend of high unemployment, with rates peaking at 7.9% in 2005. This period reflects economic restructuring and an effort to diversify the economy, moving away from a strong reliance on agriculture towards manufacturing and services.
By 2017, the unemployment rate declined to a steady 3.8%, attributed to consistent economic growth and governmental focus on infrastructure development and job creation. The 2020 pandemic caused a slight rise, reaching 4.3%, but by 2022, the rate had recovered to 3.5%. This pattern underscores Indonesia’s resilience and adaptability, as well as successful policy measures aimed at balancing labor supply and economic growth.
By 2017, the unemployment rate declined to a steady 3.8%, attributed to consistent economic growth and governmental focus on infrastructure development and job creation. The 2020 pandemic caused a slight rise, reaching 4.3%, but by 2022, the rate had recovered to 3.5%. This pattern underscores Indonesia’s resilience and adaptability, as well as successful policy measures aimed at balancing labor supply and economic growth.
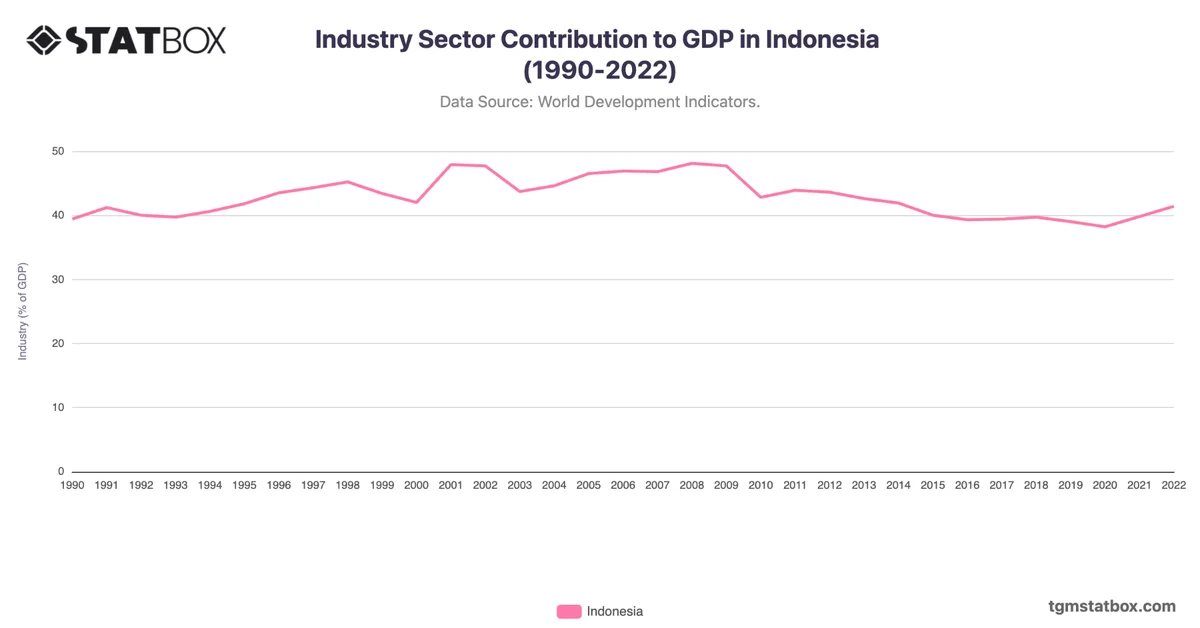
Explore related charts to gain a better understanding of Indonesia’s services sector share in GDP, Indonesia’s manufacturing sector share in GDP, Industry sector’s GDP share in Indonesia.