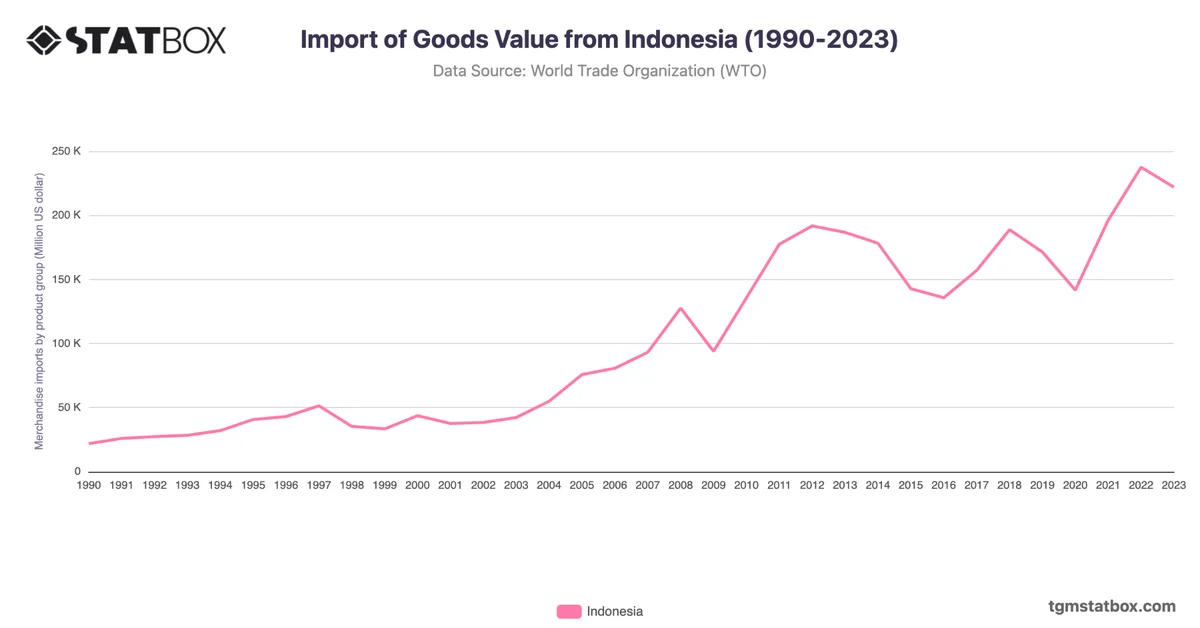
Indonesia’s exports experienced a robust upward trend, particularly from the late 1990s, reaching $194.8 billion by 2008. This growth was underpinned by high demand for commodities like coal and palm oil, which dominate the country’s trade portfolio.
Despite a dip during the 2008 financial crisis and in 2020, exports rebounded to $291.9 billion by 2022, supported by increased global commodity prices and expanded trade with key partners such as China and Japan. This illustrates the resilience of Indonesia's resource-based economy.
Despite a dip during the 2008 financial crisis and in 2020, exports rebounded to $291.9 billion by 2022, supported by increased global commodity prices and expanded trade with key partners such as China and Japan. This illustrates the resilience of Indonesia's resource-based economy.
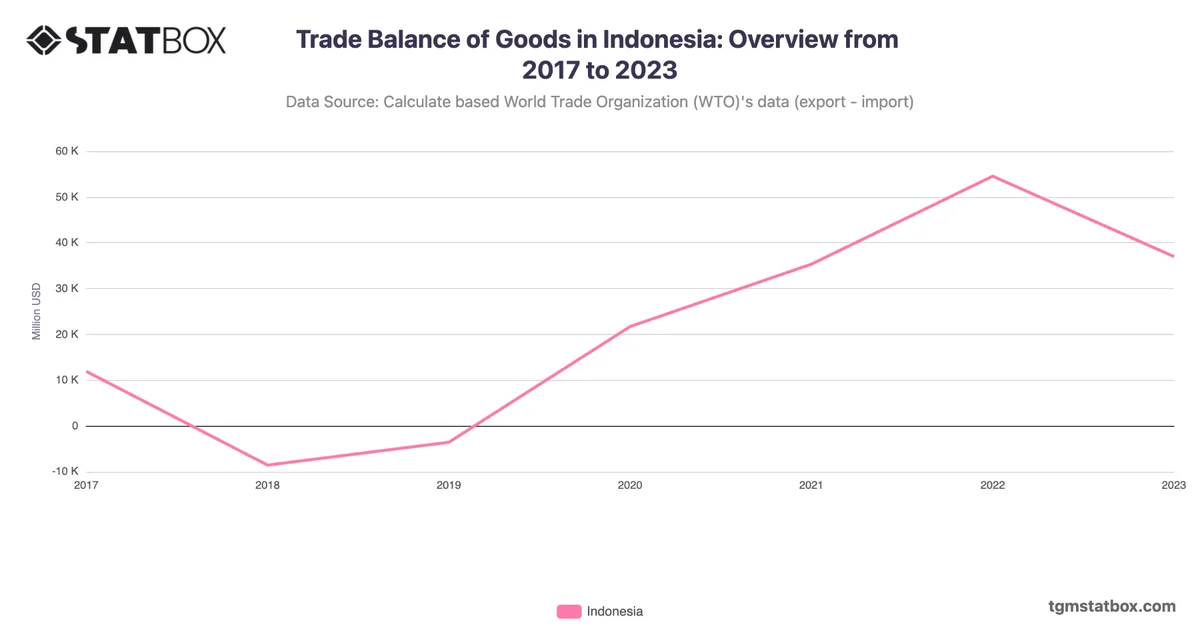
Gain a broader perspective by reviewing Indonesia’s goods trade balance, Indonesia’s annual GDP figures, Indonesia’s annual GDP growth rate.