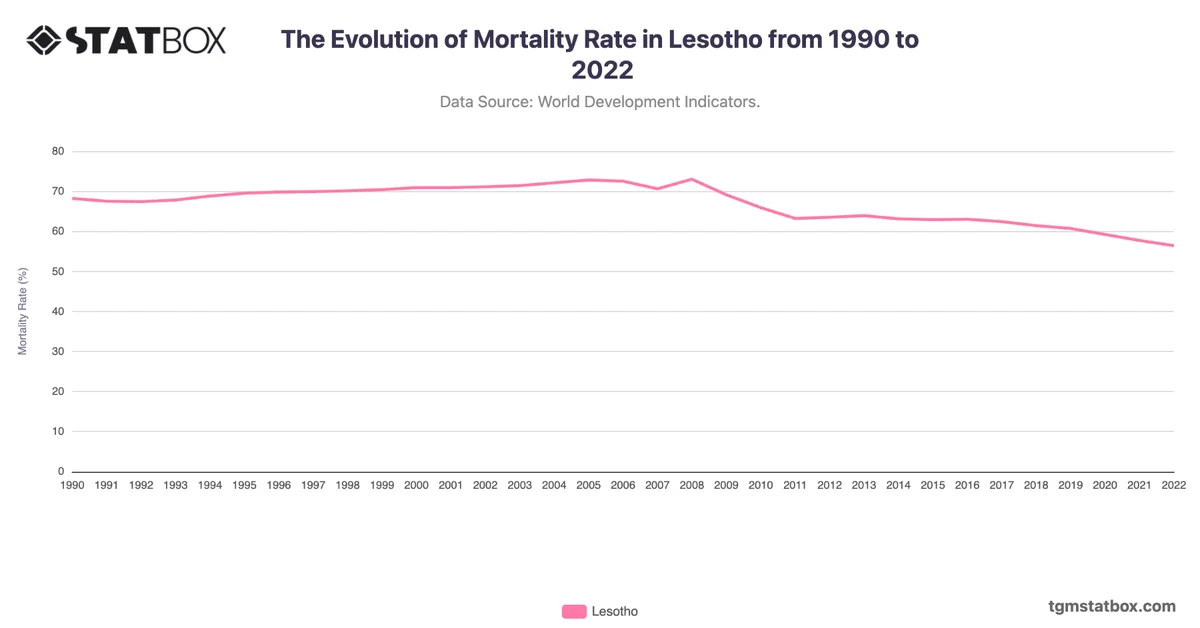
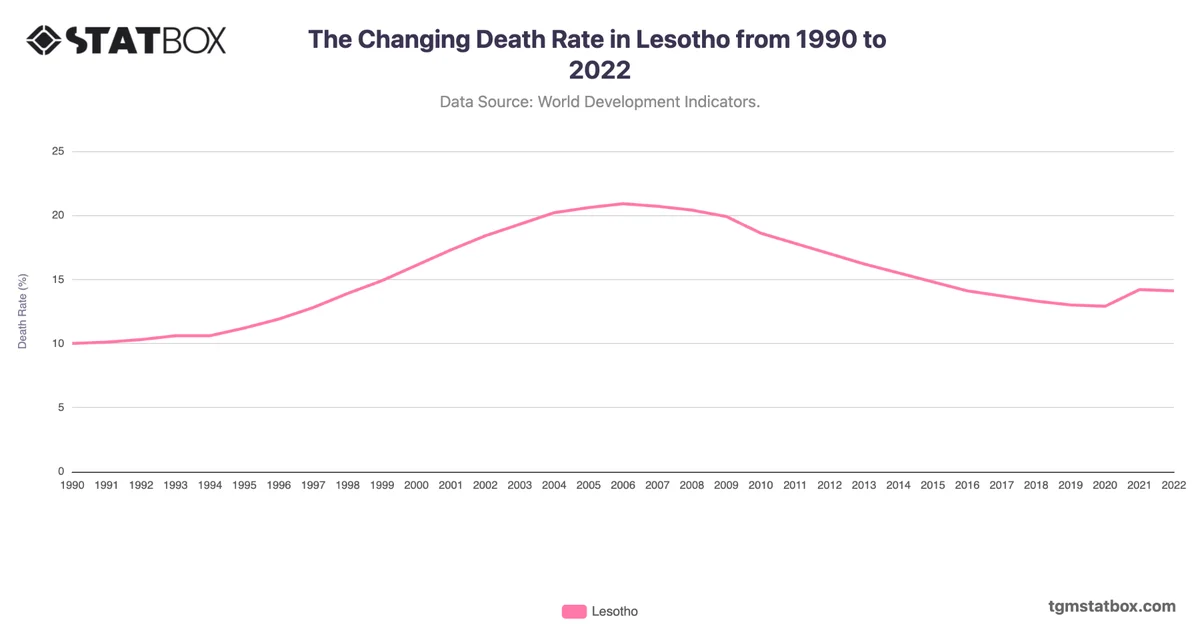
The chart highlights a significant shift in growth patterns, reflecting demographic and health-related challenges as well as gradual recovery phases.
In the early 1990s, Lesotho’s population growth began at 1.8%, but a rapid decline followed, dropping to nearly zero by 2001. This sharp decrease is linked to the impact of the HIV/AIDS epidemic, which notably affected Lesotho’s population dynamics, with high mortality rates and reduced life expectancy dampening growth significantly.
From 2002 to 2005, Lesotho even experienced negative growth, with rates reaching -0.4% at their lowest point. These years underscore the ongoing health challenges and the substantial impact of the epidemic on the nation’s demographics. However, a recovery phase began in the mid-2000s, as health interventions and international support programs gained traction, gradually improving survival rates and stabilizing population growth.
By 2010, growth had reached a modest 0.7%, continuing a steady upward trend into the next decade. From 2013 to 2020, growth rates averaged around 1.2%, reflecting Lesotho’s resilience as healthcare access improved and the population adapted to changing social and economic conditions. By 2023, growth stabilized at 1.1%, highlighting Lesotho’s gradual recovery yet ongoing need for public health initiatives and economic support to sustain a balanced demographic trajectory in the long term.
In the early 1990s, Lesotho’s population growth began at 1.8%, but a rapid decline followed, dropping to nearly zero by 2001. This sharp decrease is linked to the impact of the HIV/AIDS epidemic, which notably affected Lesotho’s population dynamics, with high mortality rates and reduced life expectancy dampening growth significantly.
From 2002 to 2005, Lesotho even experienced negative growth, with rates reaching -0.4% at their lowest point. These years underscore the ongoing health challenges and the substantial impact of the epidemic on the nation’s demographics. However, a recovery phase began in the mid-2000s, as health interventions and international support programs gained traction, gradually improving survival rates and stabilizing population growth.
By 2010, growth had reached a modest 0.7%, continuing a steady upward trend into the next decade. From 2013 to 2020, growth rates averaged around 1.2%, reflecting Lesotho’s resilience as healthcare access improved and the population adapted to changing social and economic conditions. By 2023, growth stabilized at 1.1%, highlighting Lesotho’s gradual recovery yet ongoing need for public health initiatives and economic support to sustain a balanced demographic trajectory in the long term.
Explore related charts to gain a better understanding of Lesotho’s annual GDP growth rate, Lesotho’s military spending, Lesotho’s birth life span.