France's military expenditure as a percentage of GDP experienced a notable decline over the decades. Starting at 5.4% in 1960, spending decreased significantly during the 1960s, reaching 3.5% by 1970. This reduction reflects the conclusion of France's involvement in colonial conflicts, including Algeria, and its strategic shift toward prioritizing economic growth under Charles de Gaulle’s presidency. The establishment of an independent nuclear deterrent during this period also influenced the budget allocation.
The 1980s marked a period of stabilization, with expenditure remaining steady at around 3.2%. However, the post-Cold War era saw further reductions, with spending falling to 2.8% by 1990 as geopolitical tensions eased. Despite global challenges like the Gulf War and rising terrorism concerns, France's commitment to NATO operations and the European Union kept expenditure relatively stable at approximately 2% throughout the 2000s. The uptick to 2.0% in 2020 corresponds to renewed defense priorities and modernization efforts amid increasing global uncertainties.
The 1980s marked a period of stabilization, with expenditure remaining steady at around 3.2%. However, the post-Cold War era saw further reductions, with spending falling to 2.8% by 1990 as geopolitical tensions eased. Despite global challenges like the Gulf War and rising terrorism concerns, France's commitment to NATO operations and the European Union kept expenditure relatively stable at approximately 2% throughout the 2000s. The uptick to 2.0% in 2020 corresponds to renewed defense priorities and modernization efforts amid increasing global uncertainties.
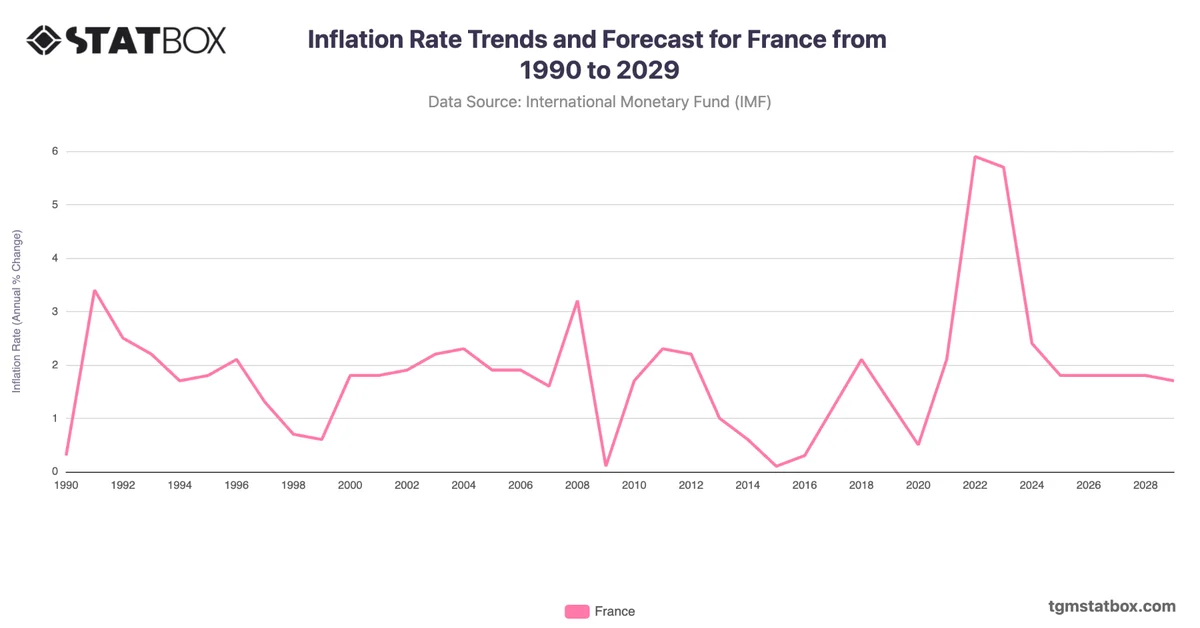
For a broader context, visit other statistics on France’s inflation rate forecast, France’s population figures, France’s fertility rate trends.