Portugal's military spending during the 1960s and early 1970s was high, peaking at 4.5% in 1967, driven by the Portuguese Colonial War in Africa. Following the Carnation Revolution in 1974 and the end of its colonial engagements, military expenditure sharply declined, reaching 2.4% by 1976.
From the 1980s to the 2000s, expenditure stabilized at around 1.4–2.0%, reflecting Portugal's integration into NATO and a focus on modernization. By 2022, military spending stood at 1.4%, showcasing a consistent prioritization of fiscal restraint while maintaining NATO obligations amidst global security challenges.
From the 1980s to the 2000s, expenditure stabilized at around 1.4–2.0%, reflecting Portugal's integration into NATO and a focus on modernization. By 2022, military spending stood at 1.4%, showcasing a consistent prioritization of fiscal restraint while maintaining NATO obligations amidst global security challenges.
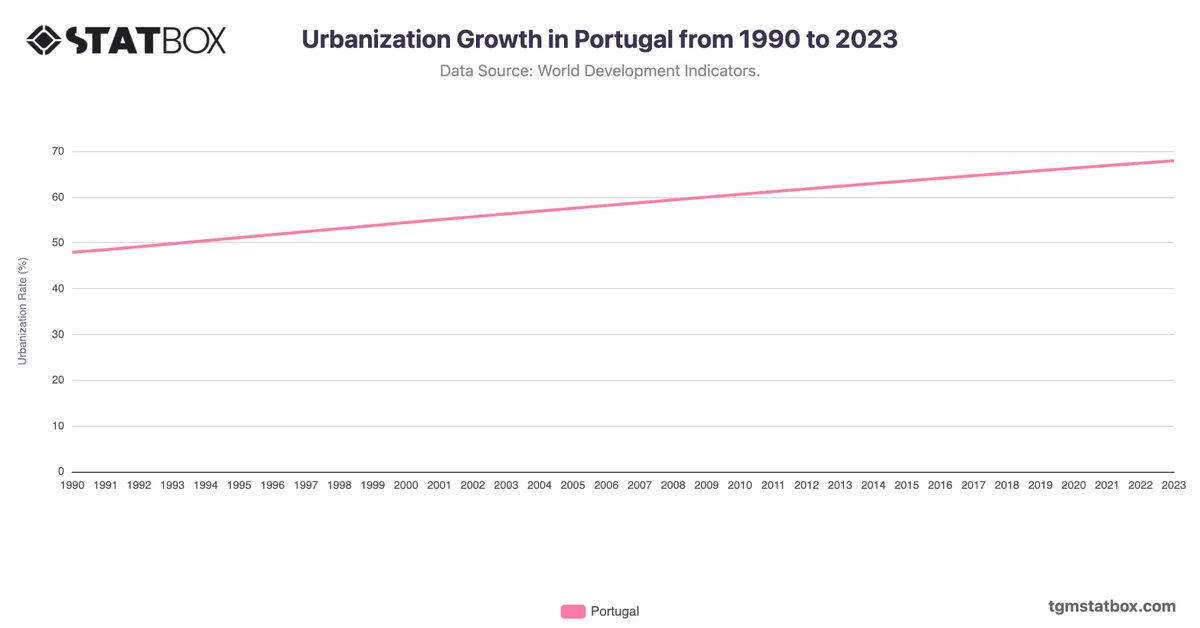
Explore related charts to gain a better understanding of Portugal’s agriculture sector share in GDP, urban expansion in Portugal, Portugal’s military personnel numbers.