Romania’s GDP highlights its transition from a communist command economy to a dynamic market economy. GDP was $38 billion in 1987, but economic restructuring during the 1990s caused fluctuations, with GDP falling to $25.1 billion in 1992. However, EU membership in 2007 significantly boosted growth, with GDP surging from $122 billion in 2006 to $214.3 billion in 2008.
Following the global financial crisis, Romania’s GDP recovered strongly, reaching $351 billion in 2023. Key contributors include agriculture, IT, and automotive manufacturing, as well as foreign investments spurred by EU structural funds.
Following the global financial crisis, Romania’s GDP recovered strongly, reaching $351 billion in 2023. Key contributors include agriculture, IT, and automotive manufacturing, as well as foreign investments spurred by EU structural funds.
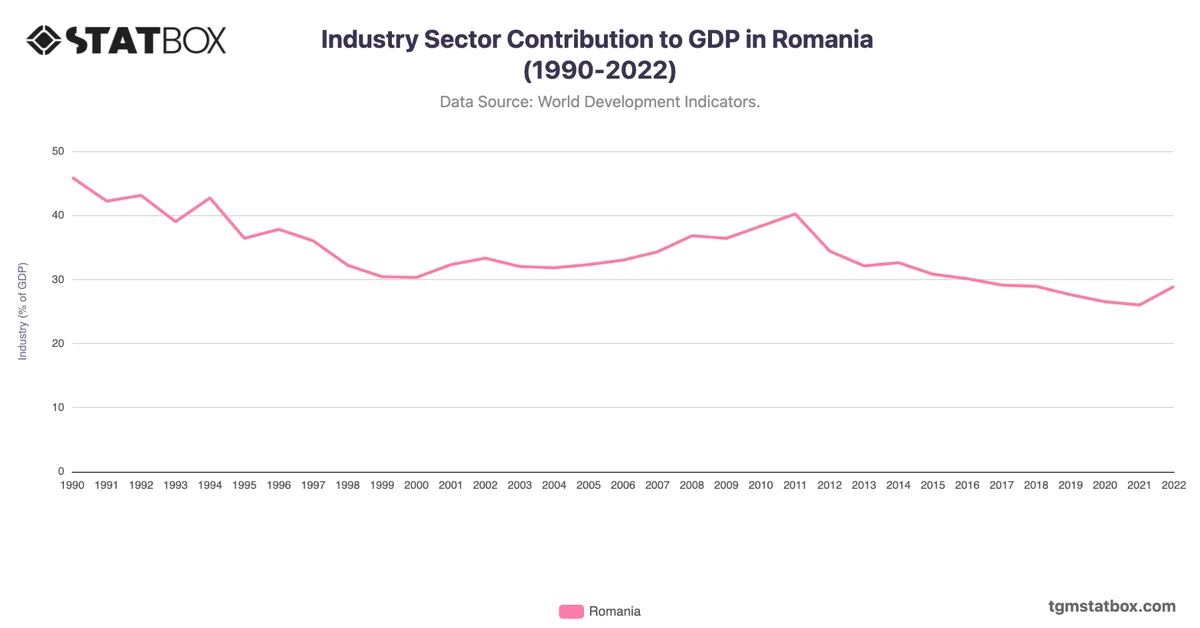
Gain a broader perspective by reviewing Romania’s manufacturing sector share in GDP, Romania’s GDP share from services, Romania’s industry sector share in GDP.