Share the statistic on social media channels or embed the statistic in your website using "Embed Code", where available.
Share chart
Embed chart Embed copied!Cite this statistic and select one of the following formats: APA, Chicago, Harvard, MLA & Bluebook
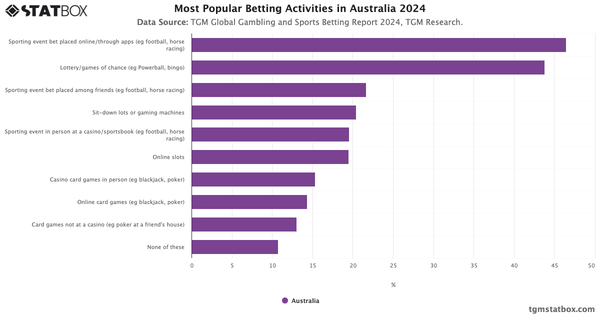
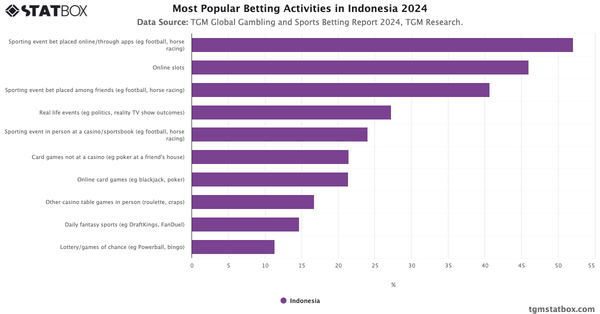
"Which of the following have you bet on in the past 12 months?"
Key Takeaways
Lottery games such as Powerball and bingo dominate betting activities among Americans, with nearly 40% of respondents participating. This high engagement reflects the accessibility and cultural familiarity of these games, often promoted through state-run lotteries and community events. In contrast, sit-down slots or gaming machines are the second most popular choice, attracting 23.7% of participants. This preference could be attributed to the immersive gaming experience and the widespread availability of slot machines in casinos and other entertainment venues.
Online and in-person card games, including blackjack and poker, also feature prominently, with participation rates of 21.1% and 20.9%, respectively. The growing adoption of online platforms and the appeal of social interaction in physical casinos contribute to these figures. Notably, sports betting through online platforms or apps (21.0%) slightly edges out in-person bets at casinos or sportsbooks (14.0%), highlighting the convenience and increasing legalization of digital sports wagering. Meanwhile, niche activities like daily fantasy sports (17.0%) and betting on real-life events (9.8%) underscore the diversification of betting options catering to varied interests.
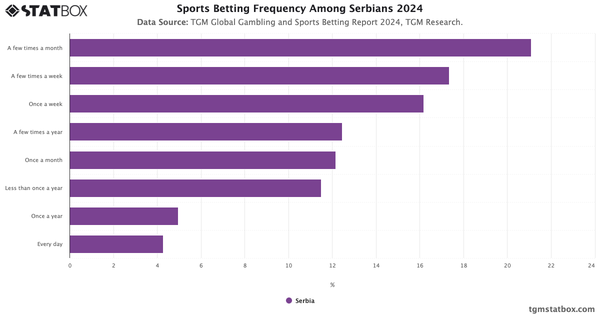
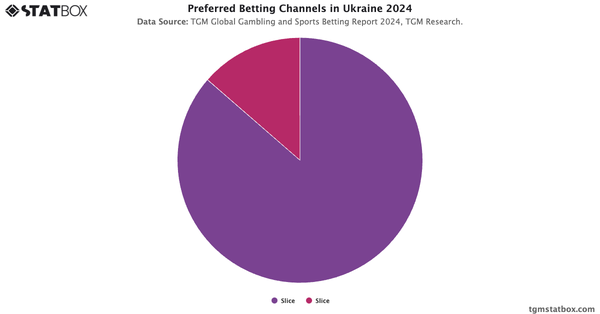
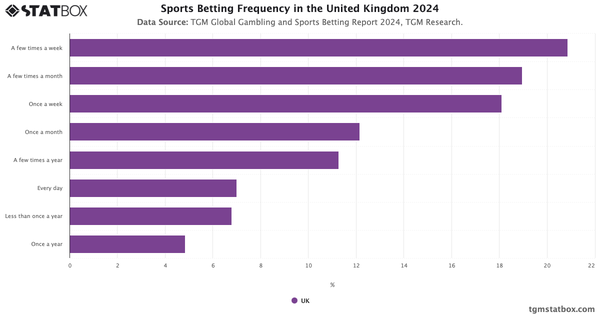
Explore related charts to gain a better understanding of sports betting frequency, favored betting channels in the USA, rise of real-time sports betting in America.

Gambling and Sports Betting Report in the United States
Learn more about Gambling and Sports Betting in the US with TGM StatBox. Explore our detailed report, complete with graphs and tables, for in-depth insights.
Go to report


Connect with our expert team for immediate assistance or comprehensive market analysis. We are always ready to support your business needs.