Share the statistic on social media channels or embed the statistic in your website using "Embed Code", where available.
Share chart
Embed chart Embed copied!Cite this statistic and select one of the following formats: APA, Chicago, Harvard, MLA & Bluebook
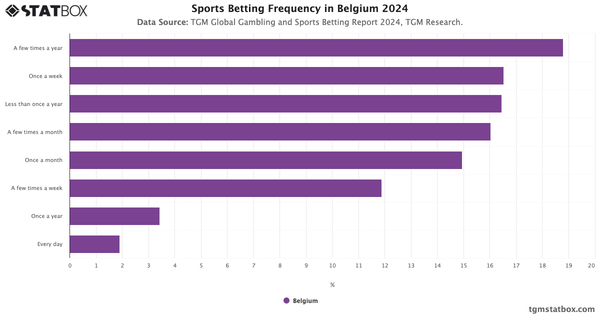
"How often do you typically bet on sports?"
Key Takeaways
Sports betting in the United States reveals a pattern of infrequent participation, with over one-third of respondents (37.7%) engaging less than once a year. This trend highlights the casual nature of sports betting for many Americans, who likely view it as an occasional recreational activity tied to major events such as the Super Bowl or March Madness. The accessibility of online platforms and widespread media coverage during these events likely play a role in drawing sporadic participants.
More regular betting behavior, such as a few times a month (13.8%) or a few times a week (9.6%), is less common but significant. These participants may represent a more engaged audience influenced by the increasing legalization of sports betting across states and the proliferation of user-friendly apps. Daily bettors, at just 3.5%, remain a niche group, potentially consisting of highly dedicated sports enthusiasts or professional gamblers.
This distribution underscores the diverse engagement levels within the American sports betting landscape, shaped by both personal interest and regulatory environments.
For a broader perspective, check out other statistics on motivations for sports betting, most popular betting activities in the US, rise of real-time sports betting in America.

Gambling and Sports Betting Report in the United States
Learn more about Gambling and Sports Betting in the US with TGM StatBox. Explore our detailed report, complete with graphs and tables, for in-depth insights.
Go to report


Connect with our expert team for immediate assistance or comprehensive market analysis. We are always ready to support your business needs.