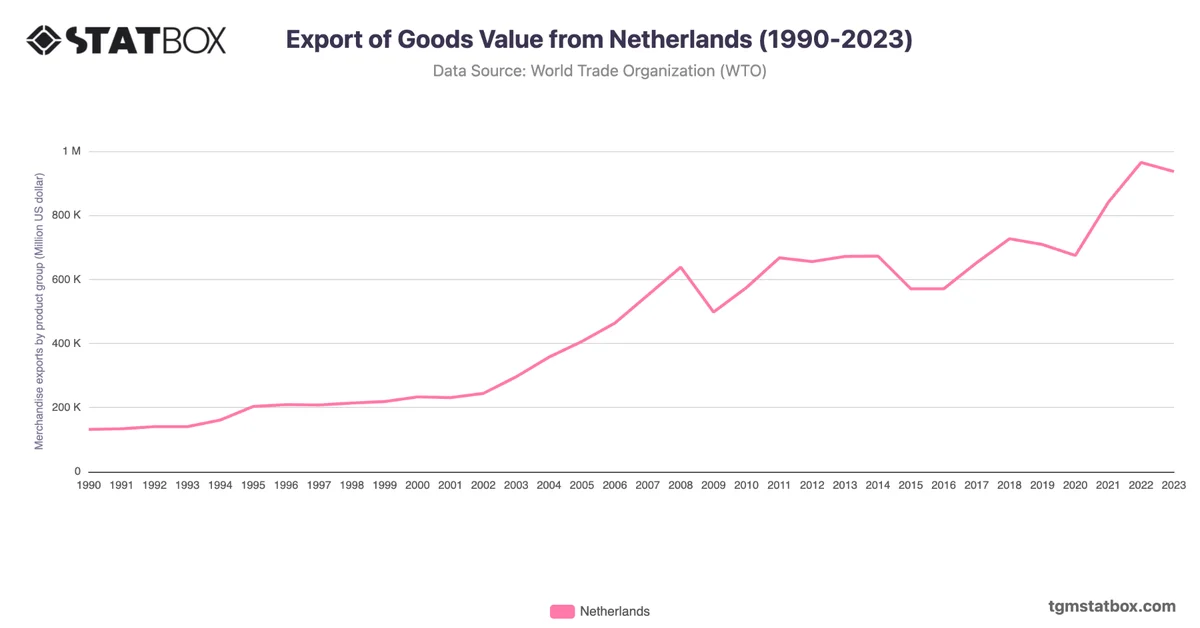
The Netherlands' imports rose from $126.1B in 1990 to $897.5B in 2022, reflecting its position as a global trade hub. The early 2000s saw robust growth, with imports increasing from $319.6B in 2004 to $580.9B in 2008, driven by its strong logistics sector and trade integration within the EU.
The 2022 peak highlights increased demand for energy, machinery, and agricultural products amid rising global prices. By 2023, imports stabilized at $842.3B, underscoring the Netherlands’ resilience and strategic importance in global supply chains.
The 2022 peak highlights increased demand for energy, machinery, and agricultural products amid rising global prices. By 2023, imports stabilized at $842.3B, underscoring the Netherlands’ resilience and strategic importance in global supply chains.
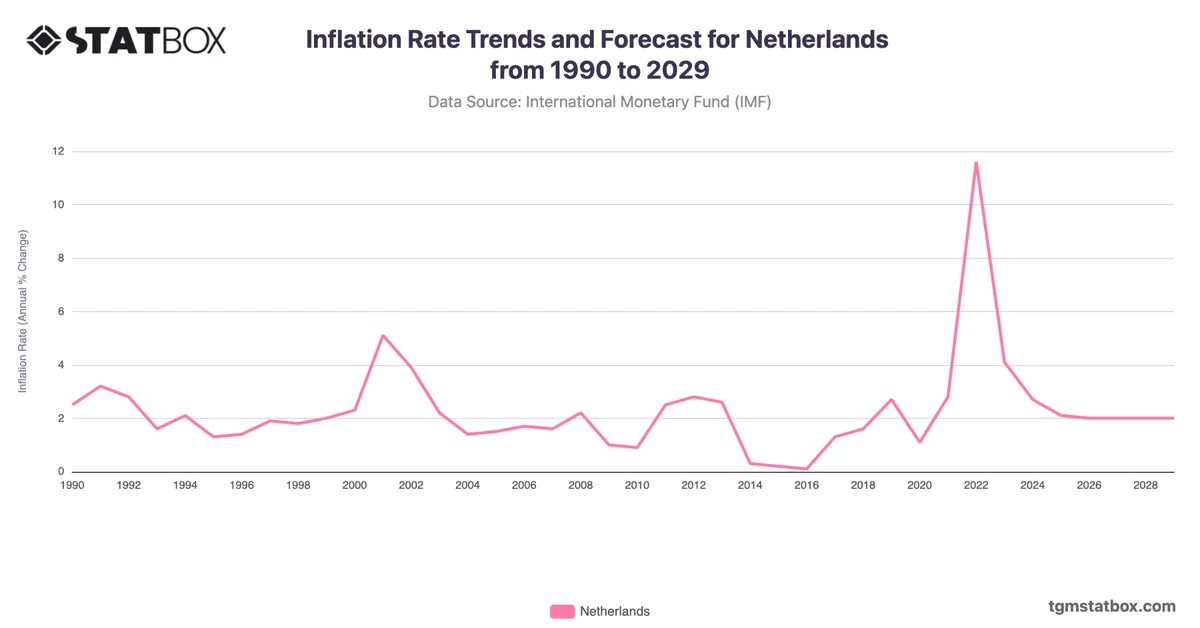
For additional information, visit statistics on Netherlands’ annual GDP growth rate, Netherlands’s population count, Netherlands’ inflation trends and outlook.