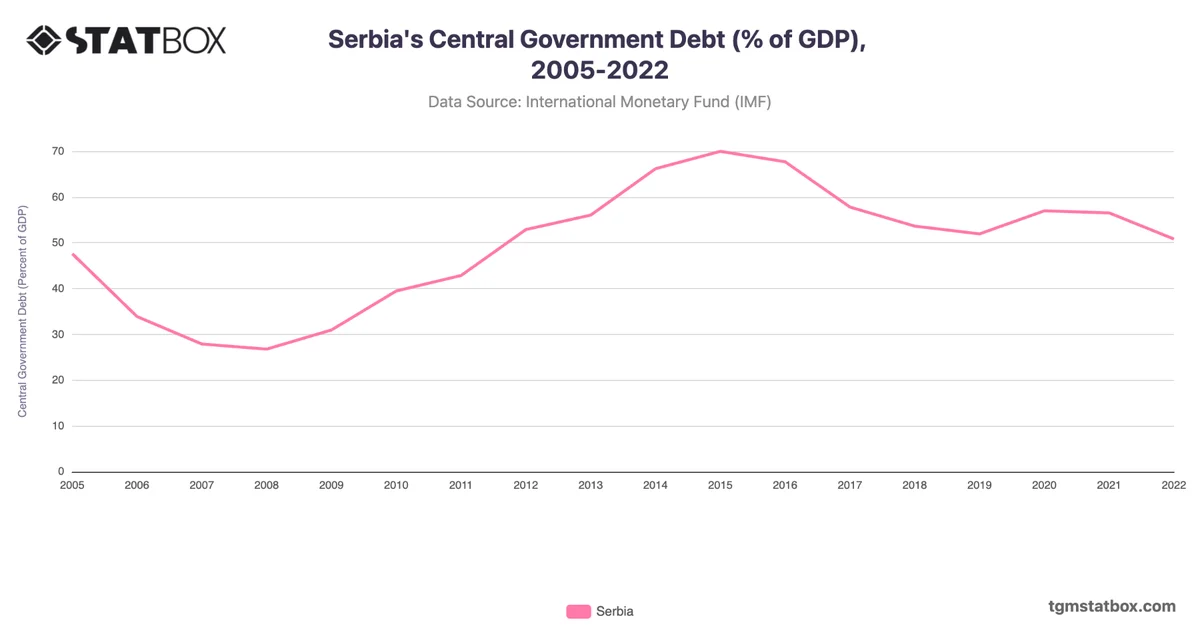
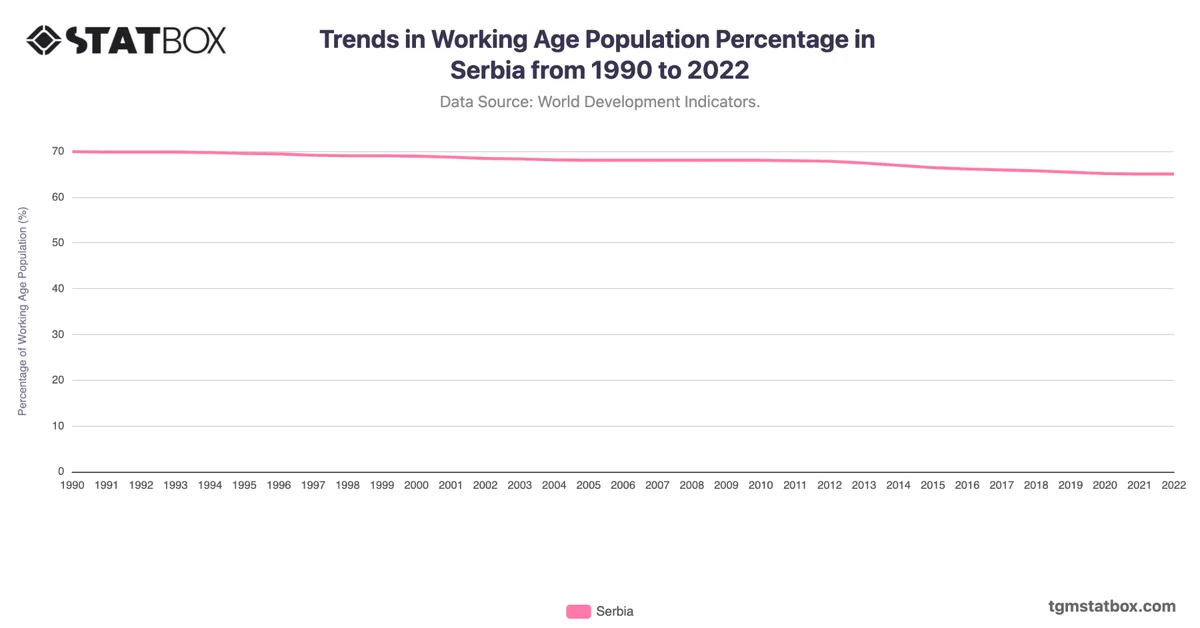
Serbia's GDP trends reflect its transition from a war-torn economy in the 1990s to gradual recovery and growth. During the 1990s, the Yugoslav Wars and international sanctions significantly impacted GDP, which fell to $6.8 billion in 2000. However, stabilization efforts and economic reforms in the early 2000s led to steady recovery, with GDP reaching $52.1 billion in 2008.
The 2008 global financial crisis caused a decline to $41.8 billion in 2010, but Serbia rebounded, bolstered by foreign investments and industrial growth. In 2023, GDP surged to $75.1 billion, reflecting increased trade, infrastructure projects, and the expansion of key industries like IT and agriculture.
The 2008 global financial crisis caused a decline to $41.8 billion in 2010, but Serbia rebounded, bolstered by foreign investments and industrial growth. In 2023, GDP surged to $75.1 billion, reflecting increased trade, infrastructure projects, and the expansion of key industries like IT and agriculture.
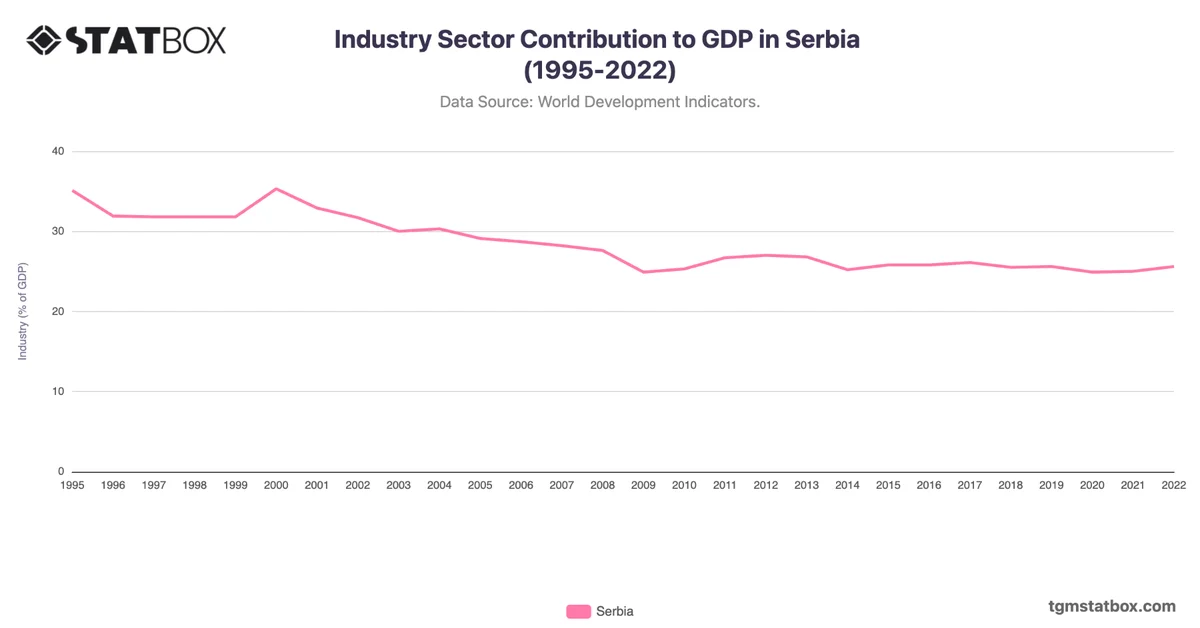
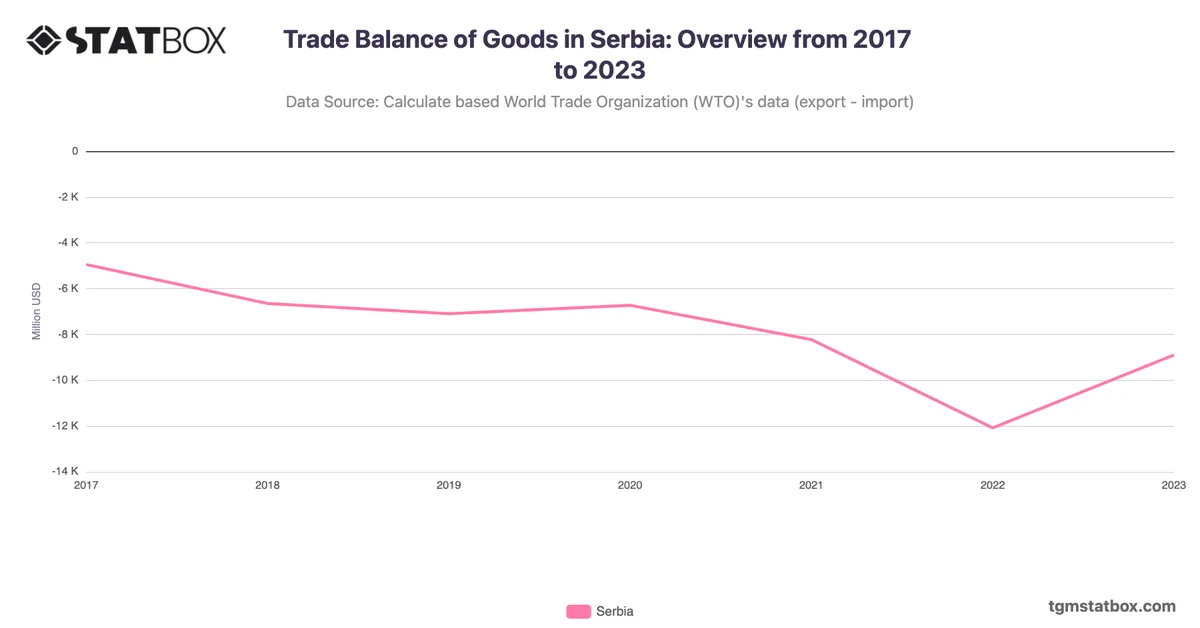
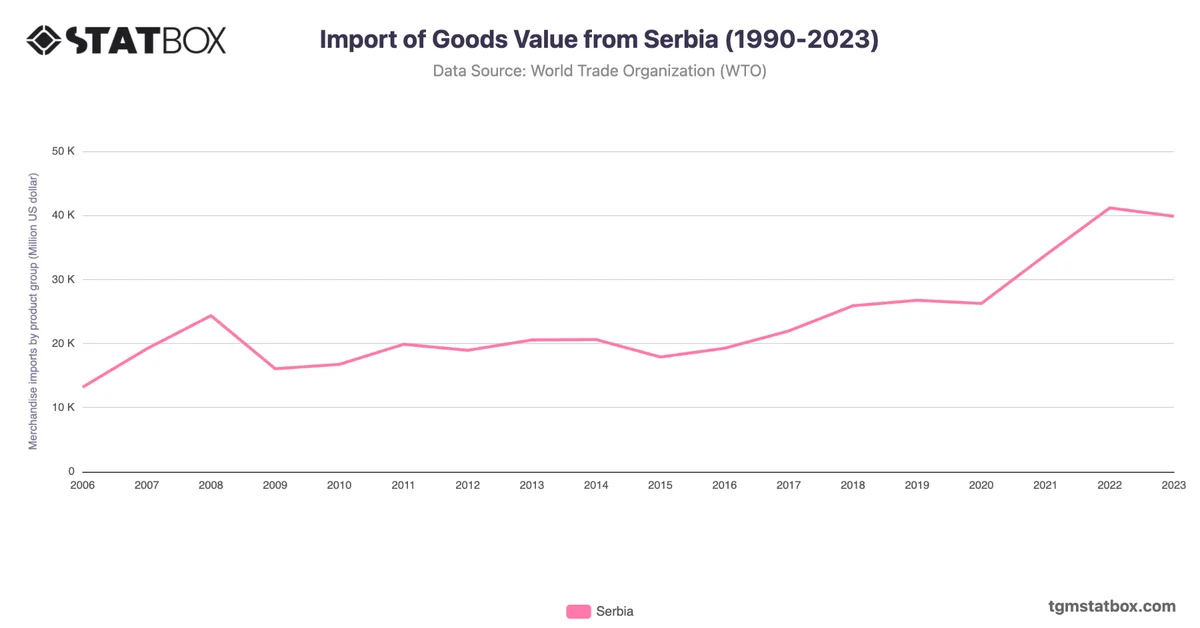
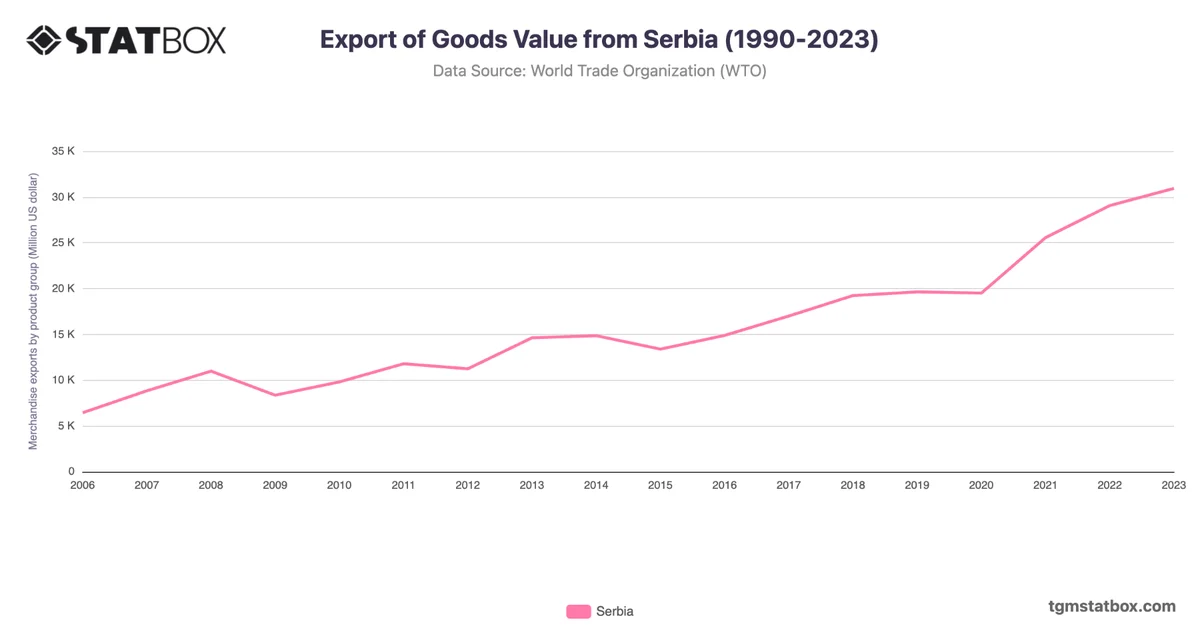
Discover additional trends and data on Serbia’s industry sector share in GDP, Serbia’s population numbers, Serbia’s goods import value.