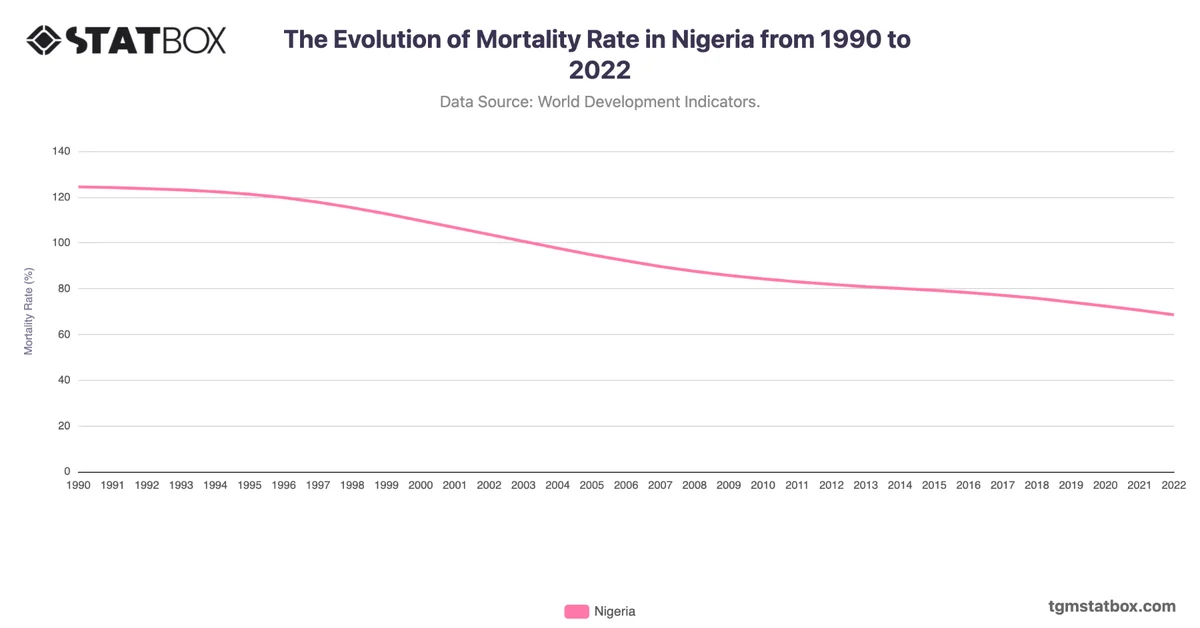
Nigeria's death rate showed a steady decline from 18.6 in 1990 to 13.0 in 2020, thanks to improved healthcare access, vaccination programs, and better disease control. However, progress has been gradual due to persistent challenges, including maternal and child mortality and infectious diseases like malaria.
The slight increase to 13.1 in 2021 reflects the impact of the COVID-19 pandemic, which strained Nigeria's healthcare system. By 2022, the death rate dropped to 12.4, signaling recovery, although healthcare infrastructure and public health remain critical areas for improvement.
The slight increase to 13.1 in 2021 reflects the impact of the COVID-19 pandemic, which strained Nigeria's healthcare system. By 2022, the death rate dropped to 12.4, signaling recovery, although healthcare infrastructure and public health remain critical areas for improvement.
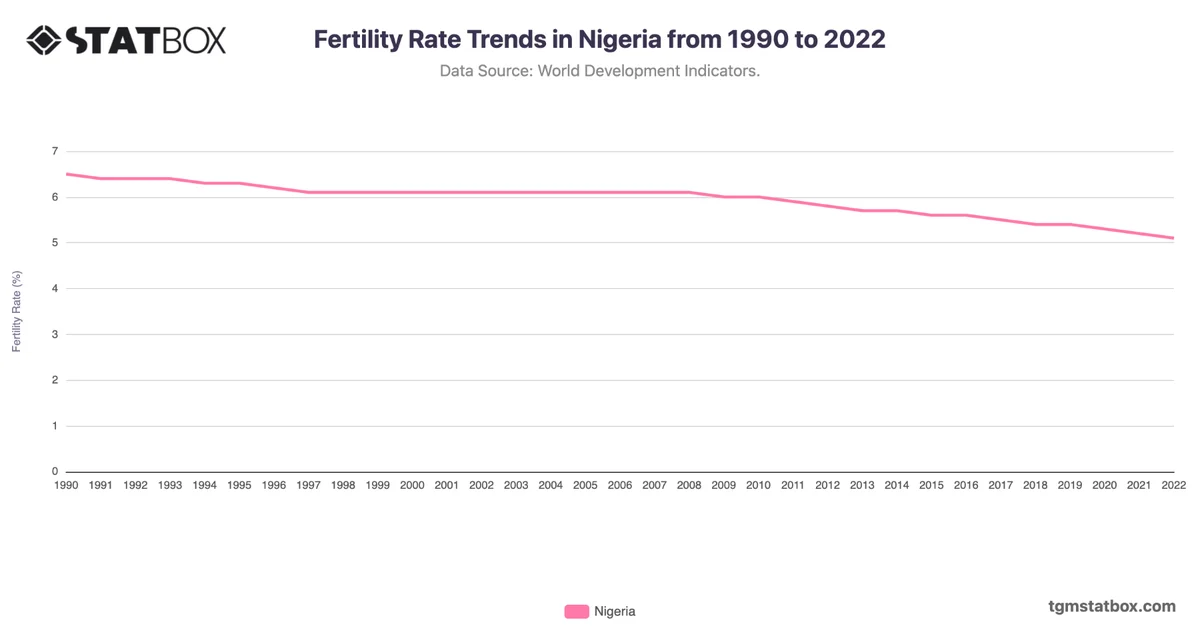
Find out more through related statistics on Nigeria’s birth life span, Nigeria’s population numbers, Nigeria’s fertility rate overview.