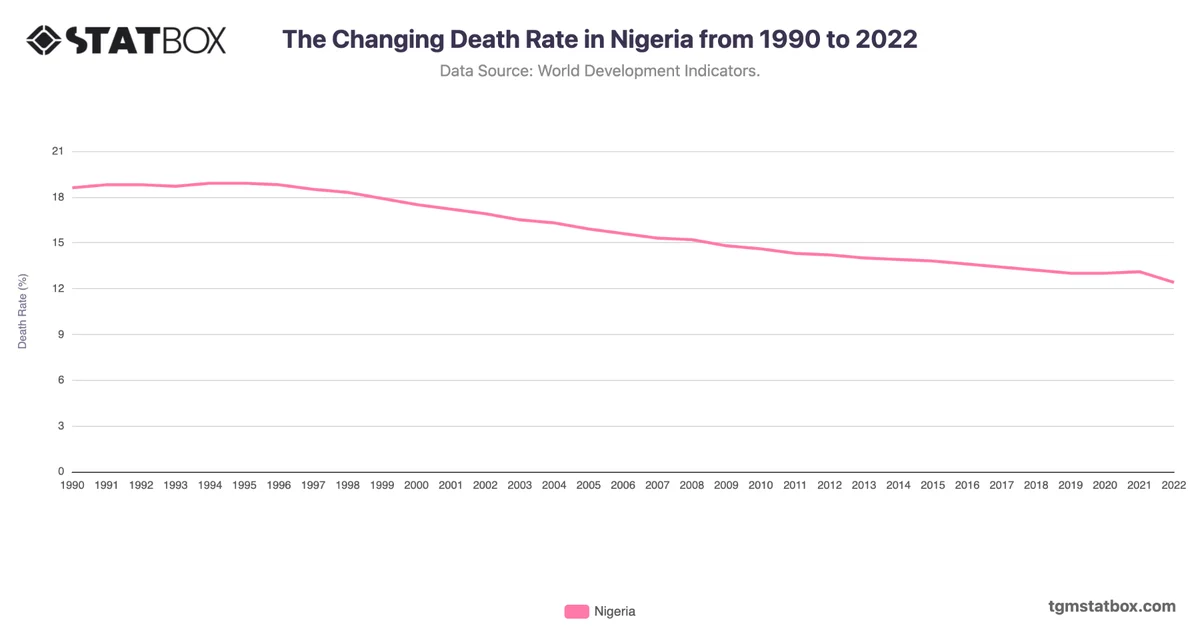
Nigeria’s mortality rate decreased from 124.4 in 1990 to 68.5 in 2022, showing gradual improvement. During the 1990s, the rate remained high, reaching 109.6 by 2000, reflecting the impact of poor healthcare infrastructure and the prevalence of infectious diseases.
Post-2000, the decline gained momentum, with the rate reaching 84.2 by 2010 and 68.5 by 2022. Contributing factors include increased immunization rates, maternal health initiatives, and expanded healthcare programs. However, challenges such as poverty, healthcare inequality, and disease outbreaks continue to impact progress.
Post-2000, the decline gained momentum, with the rate reaching 84.2 by 2010 and 68.5 by 2022. Contributing factors include increased immunization rates, maternal health initiatives, and expanded healthcare programs. However, challenges such as poverty, healthcare inequality, and disease outbreaks continue to impact progress.
For a broader context, visit other statistics on Nigeria’s birth life span, Nigeria’s population density data, Nigeria’s population growth rate.