Device Preferences Among Home & Living Shoppers by Gender
The device through which consumers complete online purchases shapes the entire shopping experience, from product browsing and image quality to checkout convenience. For Home & Living products, where visual presentation and ease of navigation matter, device choice carries particular relevance for how retailers structure their digital storefronts and prioritise platform investment.
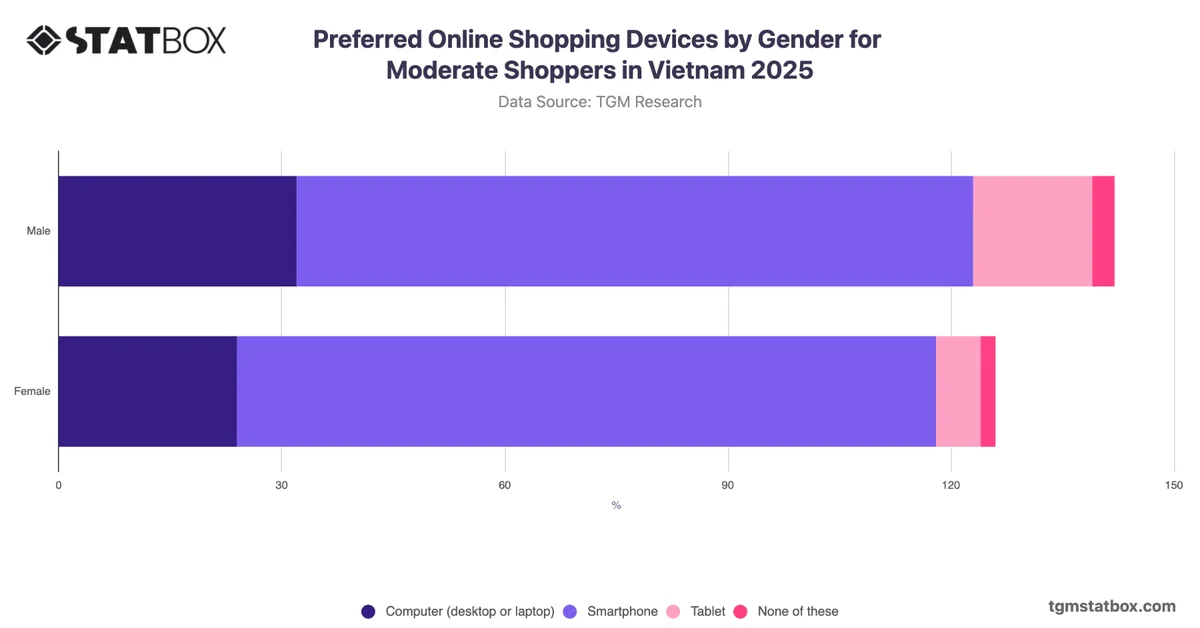
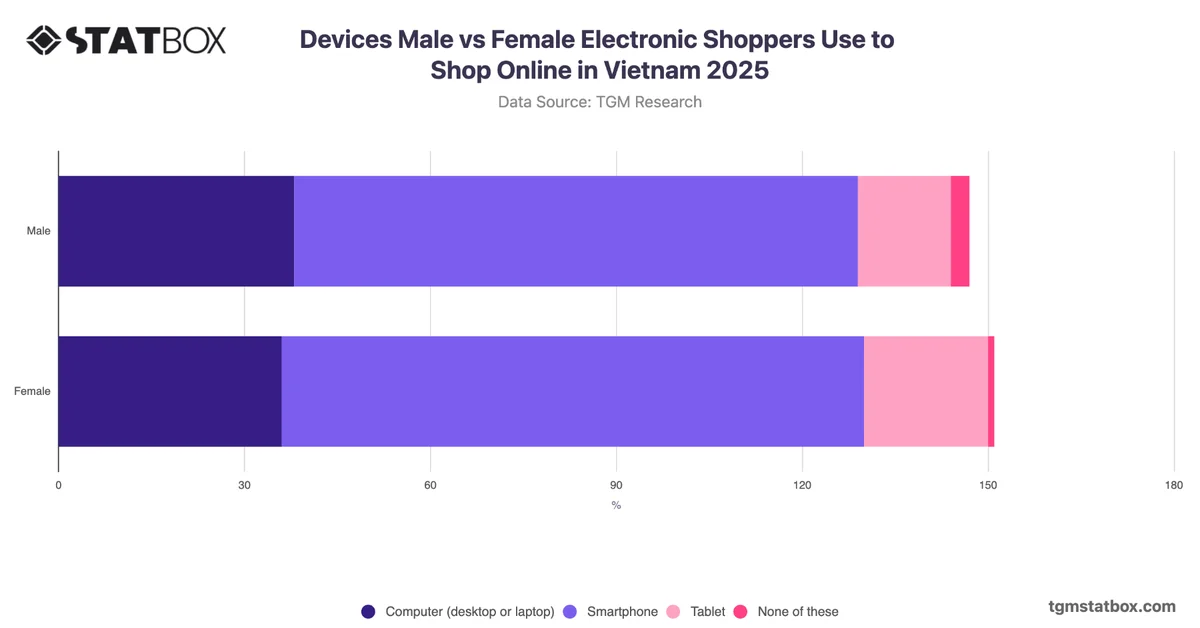
Smartphone usage is the defining characteristic of online Home & Living shopping in Vietnam in 2025, with near-universal adoption across both genders at 94% among male and 95% among female Home & Living shoppers. The gender gap here is negligible, pointing to consistent behaviour rather than a meaningful demographic divide. The more notable contrast appears in computer usage, where male Home & Living shoppers are eight percentage points more likely than their female counterparts to use a desktop or laptop (39% versus 31%). Tablet usage remains marginal for both groups at around 15% to 17%. These patterns suggest that while smartphone optimisation is a baseline requirement for reaching Home & Living buyers, retailers targeting male shoppers specifically may benefit from investing more deliberately in desktop experience quality, including larger-format product imagery and detailed specification displays suited to higher-consideration Home & Living purchases.