Pakistan's export performance from 1990 to 2023 highlights a mixed trajectory influenced by external demand and domestic challenges. Starting at $5.6 billion in 1990, exports gradually rose to $16.9 billion in 2006, fueled by textiles and agriculture.
The global financial crisis and domestic energy shortages hindered growth, with exports stagnating around $24 billion between 2013 and 2016. By 2022, exports increased to $30.9 billion, reflecting a post-pandemic recovery and government initiatives to boost textile production. However, the country’s reliance on a narrow export base limits its trade potential, necessitating diversification and infrastructure improvements.
The global financial crisis and domestic energy shortages hindered growth, with exports stagnating around $24 billion between 2013 and 2016. By 2022, exports increased to $30.9 billion, reflecting a post-pandemic recovery and government initiatives to boost textile production. However, the country’s reliance on a narrow export base limits its trade potential, necessitating diversification and infrastructure improvements.
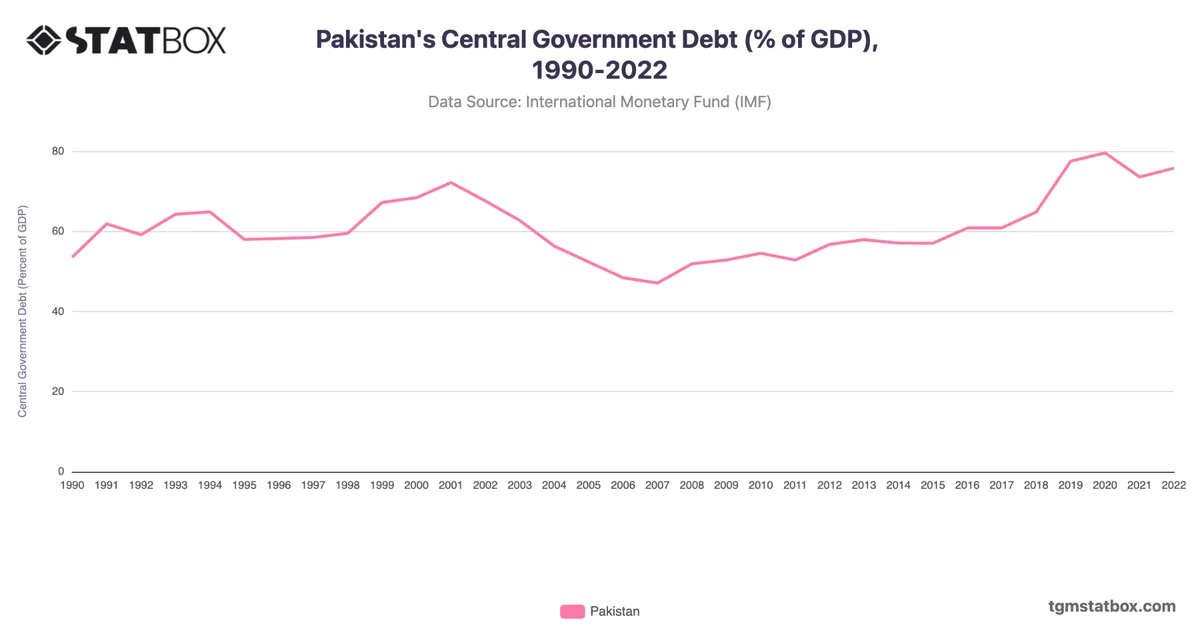
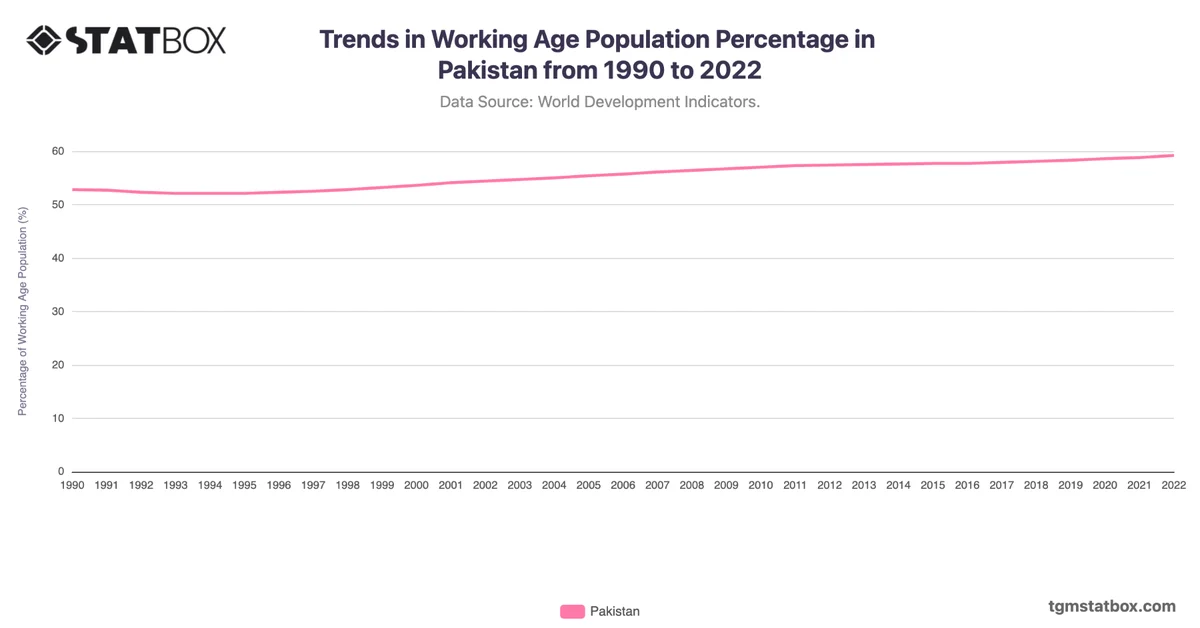
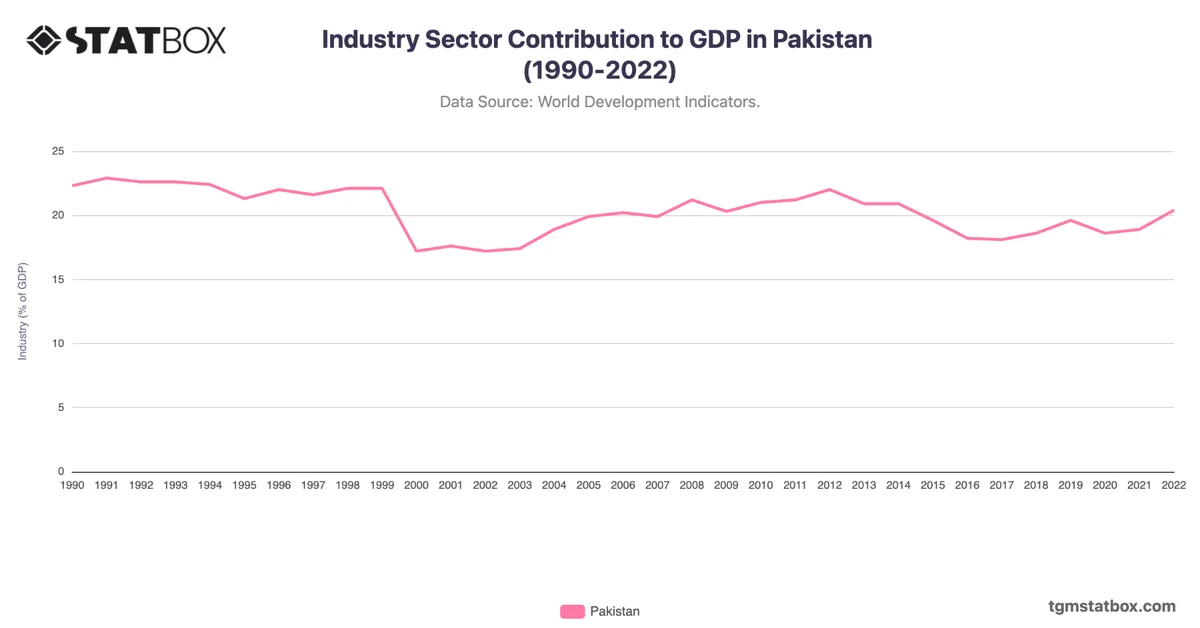
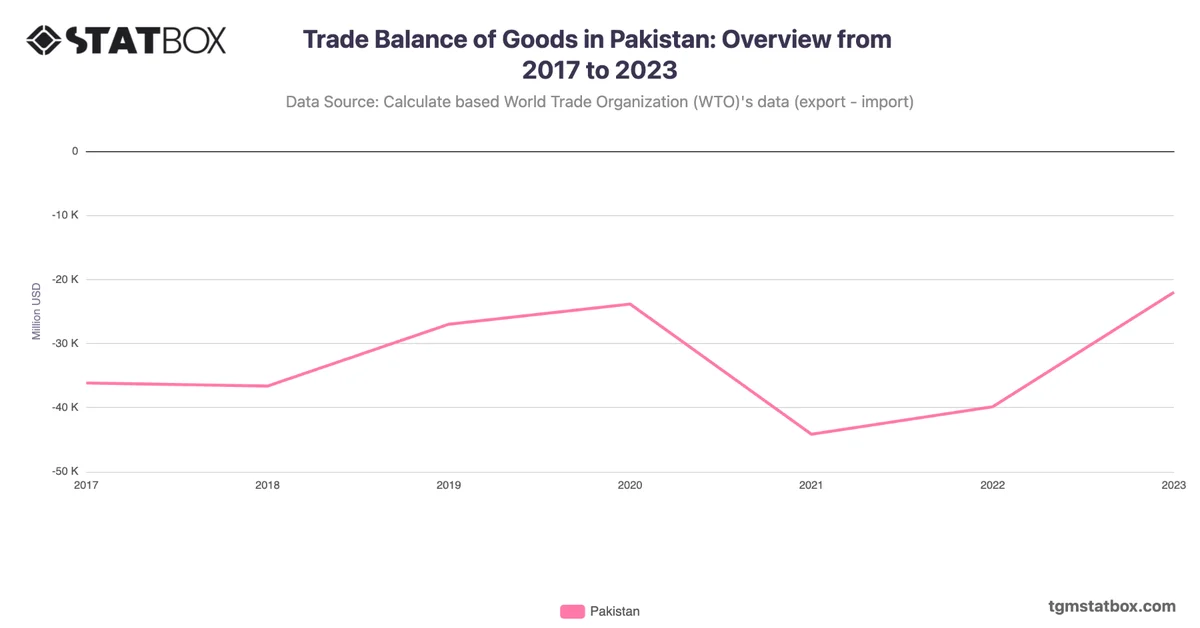
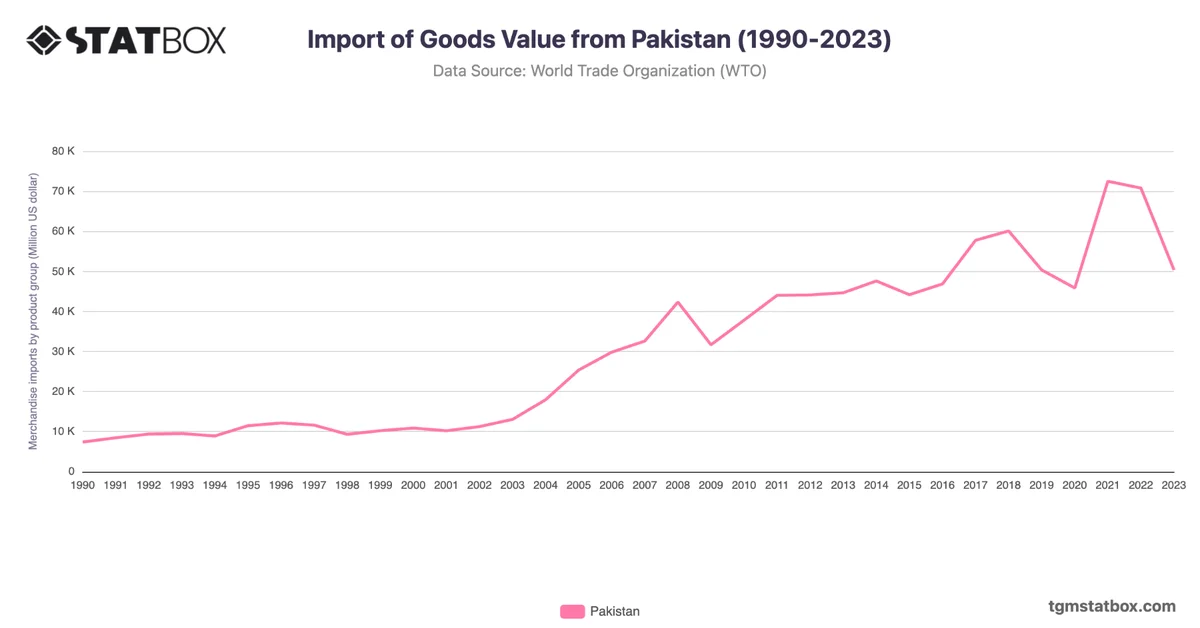
Explore related charts to gain a better understanding of Pakistan’s goods trade balance, Pakistan’s import value, Pakistan’s manufacturing sector share in GDP.