Share the statistic on social media channels or embed the statistic in your website using "Embed Code", where available.
Share chart
Embed chart Embed copied!Cite this statistic and select one of the following formats: APA, Chicago, Harvard, MLA & Bluebook
The GDP growth rate in the context of the World Development Indicators (WDI) refers to the annual percentage increase or decrease in a country's Gross Domestic Product (GDP), adjusted for inflation. The WDI is a comprehensive database maintained by the World Bank that tracks various economic, social, and environmental development indicators across the globe.
Key Takeaways
Peru GDP Growth (1961-2023)
Peru’s GDP growth reveals a pattern of resilience and sharp fluctuations. The 1980s brought contractions due to hyperinflation, while liberalization in the 1990s spurred growth, peaking at 12.3% in 1994. After sustained growth into the 2000s, the pandemic in 2020 led to a steep -10.9% contraction, but recovery in 2021 brought 13.4% growth. By 2023, growth slowed to -0.6% as political instability and global economic shifts impacted performance.
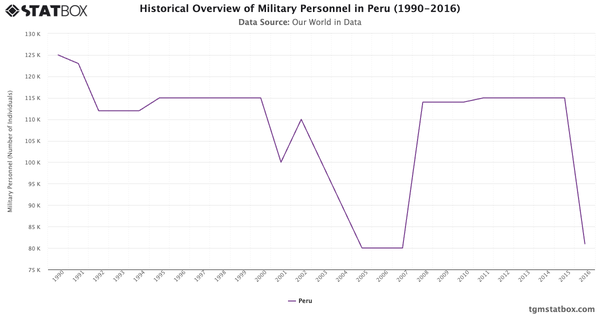
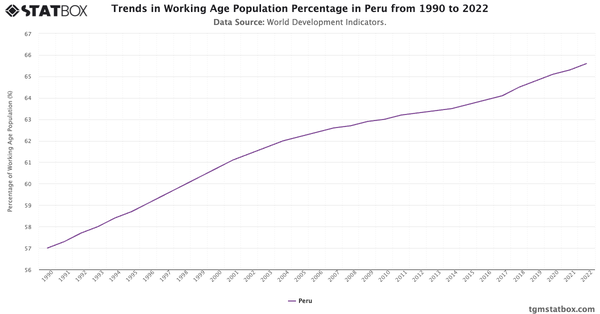
For a deeper dive into the topic, explore Peru’s military spending, Peru’s population stats, Peru’s GDP data.

Peru Sustainability Insights Report 2024
Discover how people in Peru think and act on sustainability. TGM delivers localized, data-driven insights to support responsible business decisions and global impact.
Go to report


Connect with our expert team for immediate assistance or comprehensive market analysis. We are always ready to support your business needs.