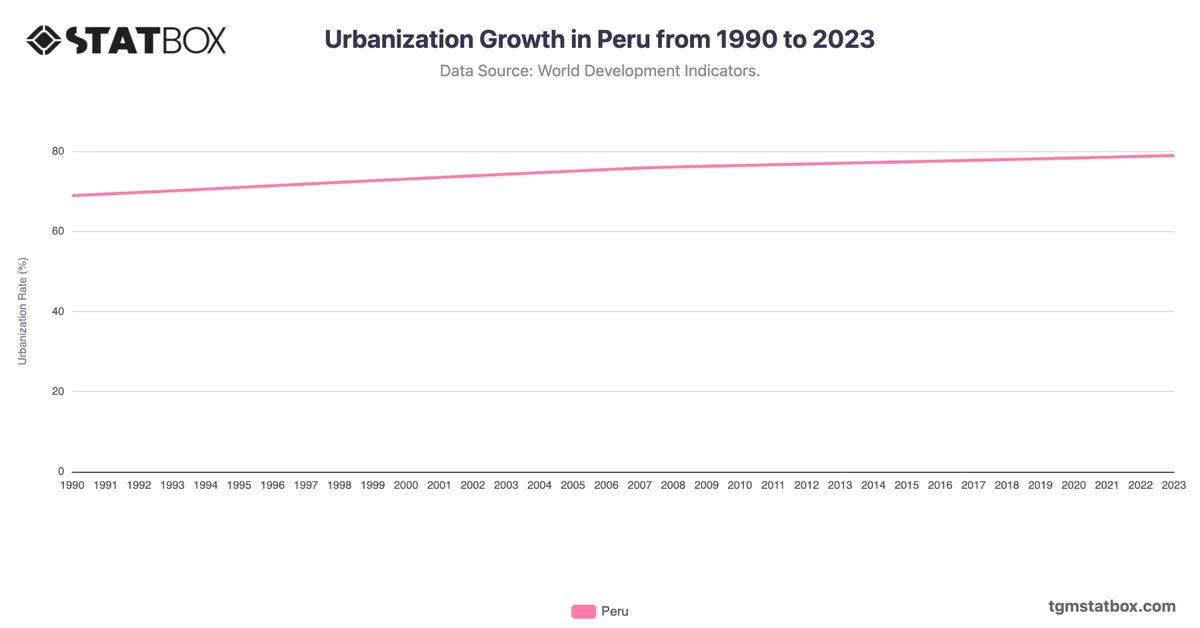
Peru’s population density increased gradually from 17 people per square kilometer in 1990 to 26 in 2021, marking a steady rise as urbanization progressed. This growth is concentrated in cities like Lima, where economic opportunities attract migration from rural regions. While Peru has a high birth rate, significant rural land keeps national density lower than its urban centers.
Despite the gradual increase, Peru’s density remains modest on a national scale. Urban centers continue to grow in population, though rural regions maintain low density, reflecting the country’s urban-rural balance and developmental focus on major cities.
Despite the gradual increase, Peru’s density remains modest on a national scale. Urban centers continue to grow in population, though rural regions maintain low density, reflecting the country’s urban-rural balance and developmental focus on major cities.
For a deeper dive into the topic, explore Urbanization rate in Peru, Peru’s military share in population, Peru’s population growth.