Peru’s military personnel as a percentage of its population saw modest fluctuations, beginning at 0.6% in 1987 and gradually declining to 0.3% by 2016. The initial higher levels correspond to a period of internal conflict, particularly with insurgent groups, requiring a substantial military presence. This reduced following the stabilization of domestic security and the establishment of more robust civilian governance.
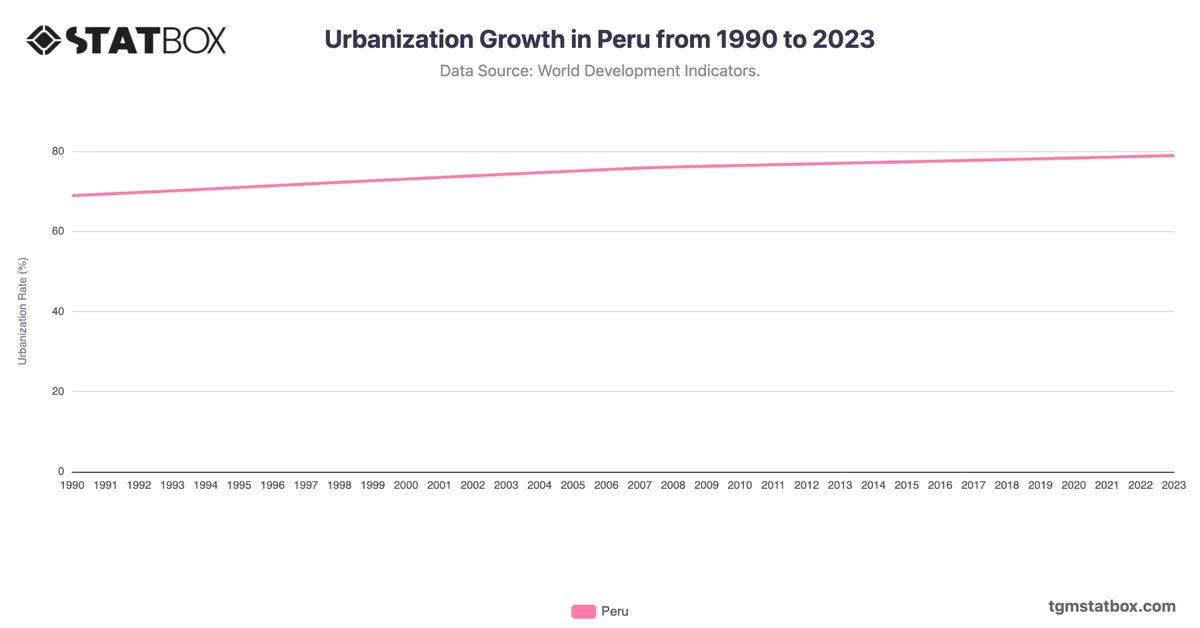
With urbanization trends accelerating in Peru, there was a gradual shift in focus from military expenditures to urban infrastructure and public services, which contributed to the decline in military personnel ratio. The relatively lower percentages in the 2000s reflect a broader commitment to development and an adjustment toward a smaller, professional military force aligned with Peru’s shifting security needs and economic priorities.
With urbanization trends accelerating in Peru, there was a gradual shift in focus from military expenditures to urban infrastructure and public services, which contributed to the decline in military personnel ratio. The relatively lower percentages in the 2000s reflect a broader commitment to development and an adjustment toward a smaller, professional military force aligned with Peru’s shifting security needs and economic priorities.
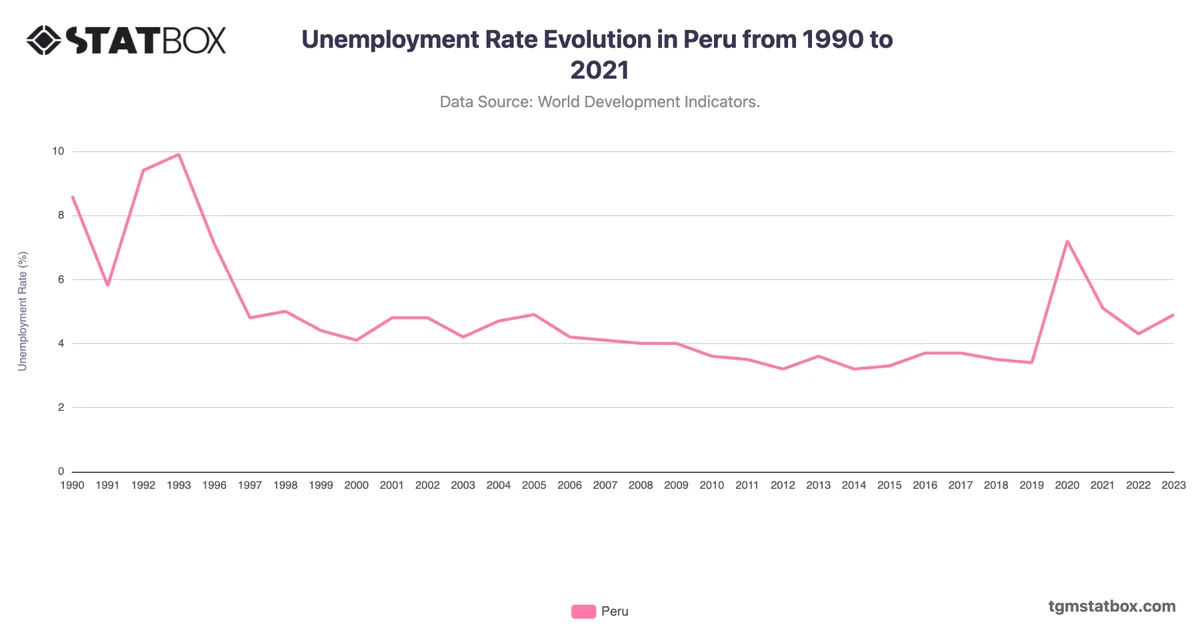
Discover additional trends and data on Peru’s population stats, Peru’s shifting median age, Peru’s unemployment rate.