Gender Differences in Pet Ownership Sentiment in Indonesia
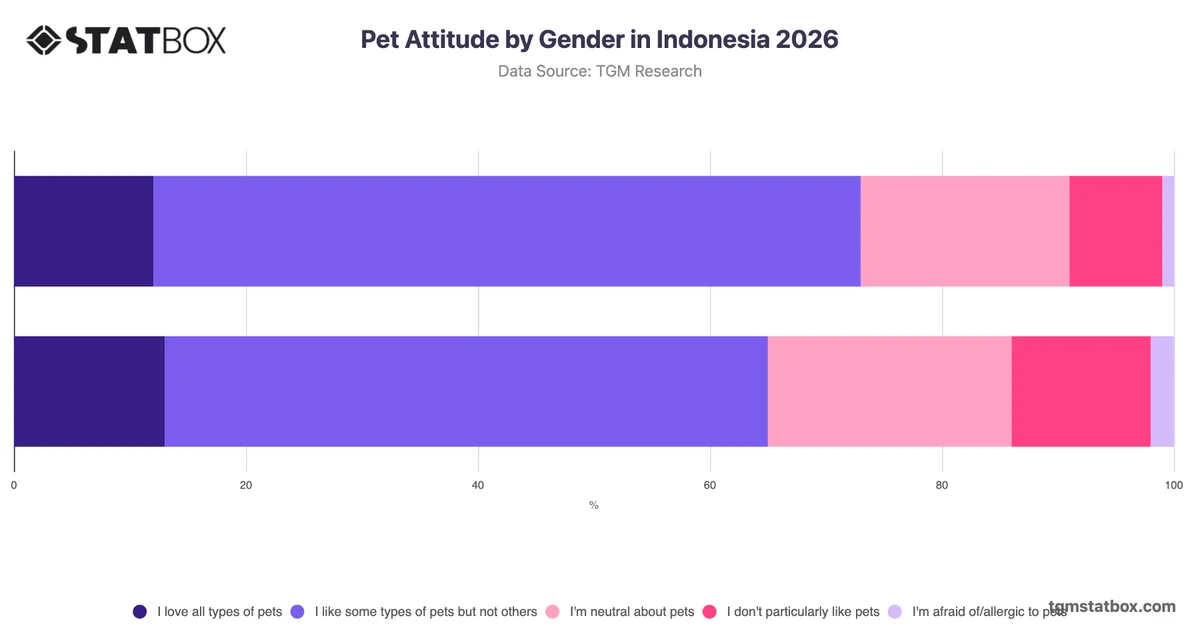
Attitudes toward pets span a broad spectrum, from deep affection and active ownership to indifference and avoidance. In Indonesia, where household circumstances, urban density, and lifestyle considerations all shape the practicality of pet ownership, understanding how sentiment is distributed across gender lines provides meaningful context for consumer segmentation.
The most analytically notable pattern is not the largest single response but the contrast in how males and females express constrained affection. Males are more likely to report loving pets while being unable to own one at present, at 32% compared to 28% among females, suggesting a higher level of suppressed demand among men. Females, by contrast, are notably more inclined to like pets but actively prefer not to own one, at 23% versus 16% for males, a seven-point gap that points to a more deliberate opt-out rather than circumstantial limitation. Taken together, both groups show broadly positive orientations toward pets, yet neither gender demonstrates strong readiness for ownership. Organisations developing pet-related products or services may benefit from treating these two segments differently, directing aspirational or barrier-removal messaging toward males and preference-respecting content toward females.