Gender Parity in Pet Ownership Attitudes in Japan
Pet ownership occupies a distinct role in household decision-making, touching on lifestyle preferences, living arrangements, financial commitment, and long-term responsibility. In Japan, where urban density and varied household structures shape consumer behaviour, understanding how pet ownership is distributed across demographic groups carries practical relevance for product positioning and audience targeting.
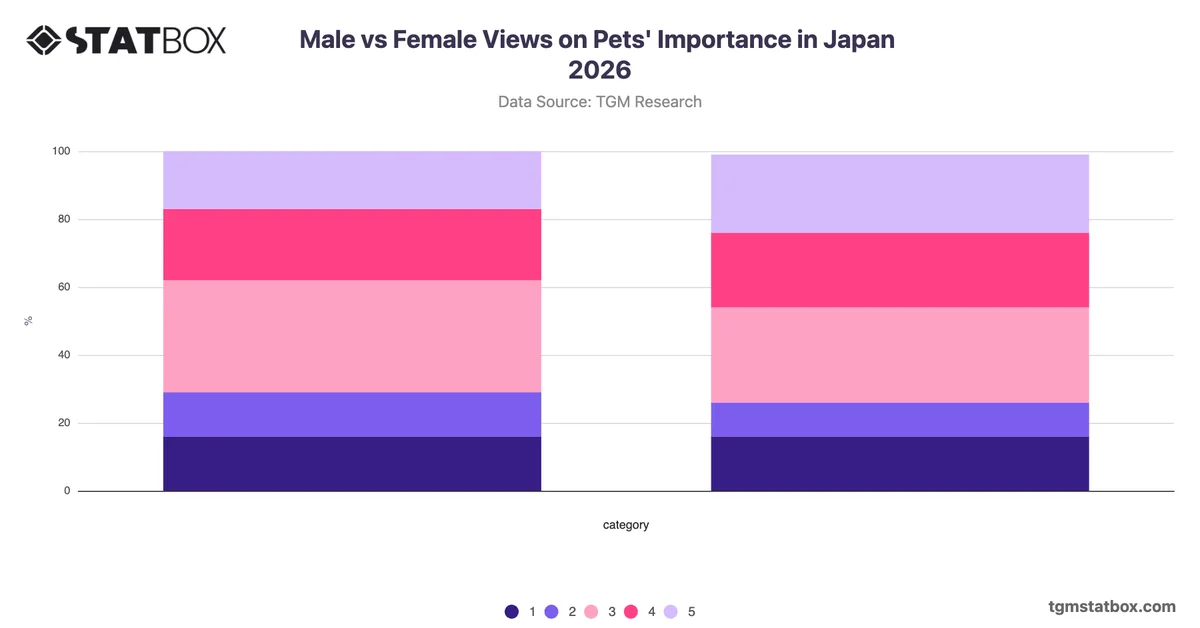
The most analytically notable feature of pet ownership in Japan is the complete absence of a gender gap. Both male and female respondents report identical ownership rates, with 53% having owned a pet and 47% having not, across both groups. This degree of consistency is uncommon in consumer research and points to pet ownership as a behaviour that is not meaningfully differentiated by gender. The near-even split between owners and non-owners further suggests that the market has not reached saturation, yet no single group represents a clearly underserved audience. For organisations targeting pet owners in Japan, gender-based segmentation is unlikely to yield meaningful differentiation. Research and communication strategies may be better directed toward other variables, such as household composition, age cohort, or regional context, to identify segments with stronger attitudinal or behavioural distinctions.