Gender Variation in Pet Ownership Across the South Korean Market
Pet ownership is a consumer behaviour with broad implications for household spending, lifestyle choices, and product demand. In South Korea, the relationship between pet keeping and daily life intersects with housing conditions, urban density, and personal circumstances, making ownership patterns a meaningful indicator of underlying consumer priorities and lifestyle orientation.
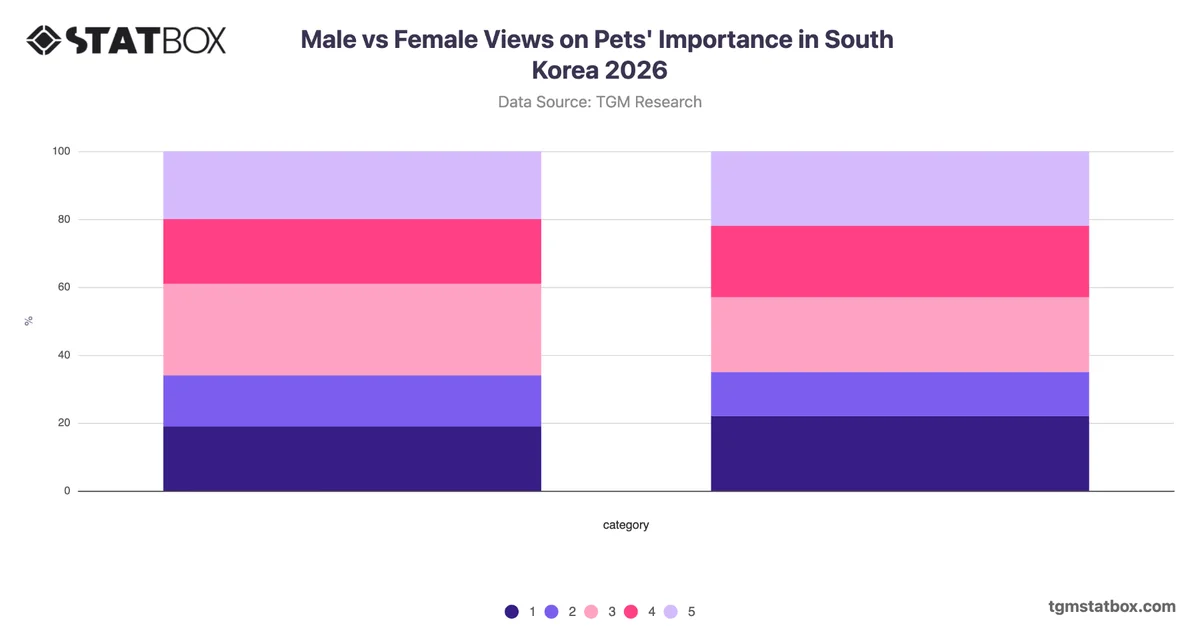
The most notable insight from the data is not simply that male respondents own pets at a higher rate, but that the seven-percentage-point gap between males (42%) and females (35%) is meaningful enough to suggest a demographic distinction worth examining in segmentation strategy. Across both groups, however, non-ownership is the majority position, with 58% of males and 65% of females reporting no current pet. This indicates that pet ownership in South Korea remains a minority behaviour rather than a broadly adopted norm. The pattern suggests that pet-related products and services may be reaching a defined but limited consumer base, with male households representing a moderately stronger concentration. Organisations targeting pet owners should consider whether male and female owners differ not only in ownership rates but also in category preferences, spending levels, or engagement with pet care services, as those distinctions would have direct implications for product positioning and communication targeting.