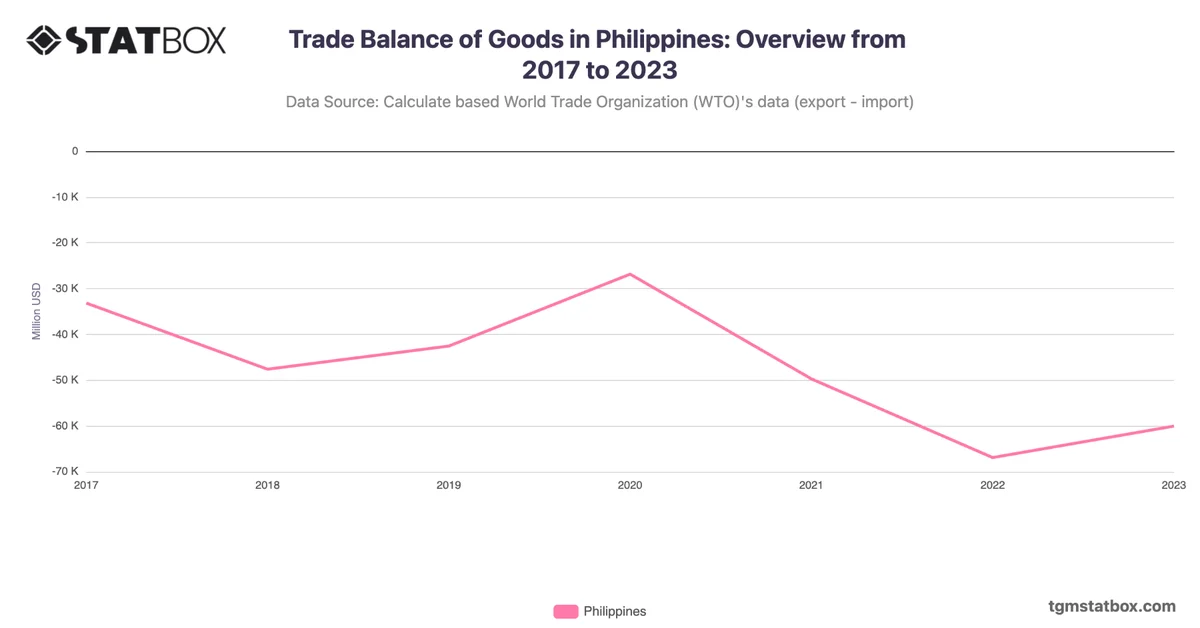
The Philippines’ import value grew steadily from $13B in 1990 to $145.9B in 2022, reflecting economic expansion and integration into global trade networks. The 1990s saw significant growth, with imports doubling from $28.3B in 1995 to $60.4B in 2008, driven by industrialization and consumer demand.
After a pandemic-related dip to $90.7B in 2020, imports surged to $145.9B in 2022, supported by recovery in manufacturing and infrastructure projects. The stabilization at $133.8B in 2023 reflects adjustments to global supply chain pressures. The Philippines’ import patterns highlight its reliance on energy and consumer goods.
After a pandemic-related dip to $90.7B in 2020, imports surged to $145.9B in 2022, supported by recovery in manufacturing and infrastructure projects. The stabilization at $133.8B in 2023 reflects adjustments to global supply chain pressures. The Philippines’ import patterns highlight its reliance on energy and consumer goods.
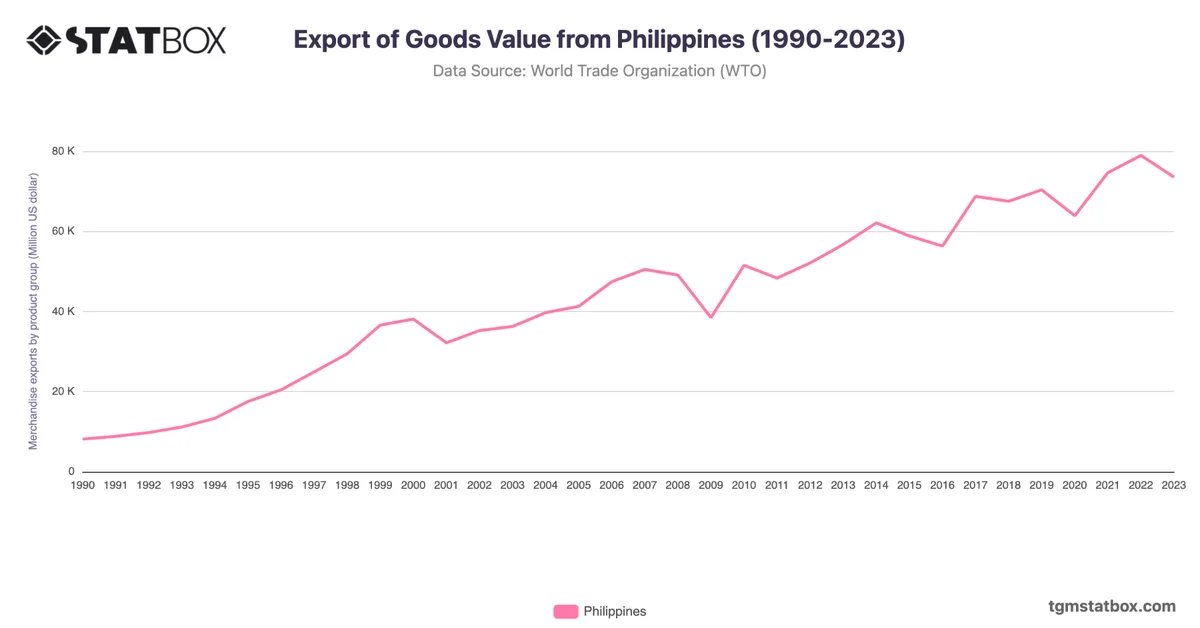
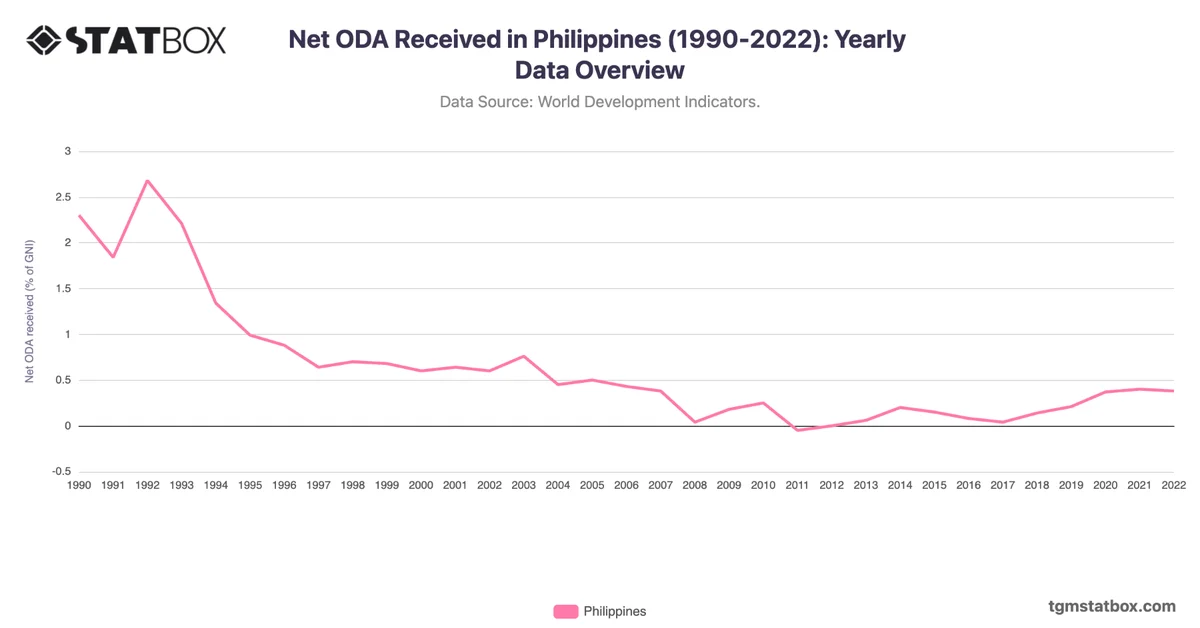
Discover additional trends and data on Philippines’ export value, Philippines’ urbanization trend, Annual net ODA for the Philippines.