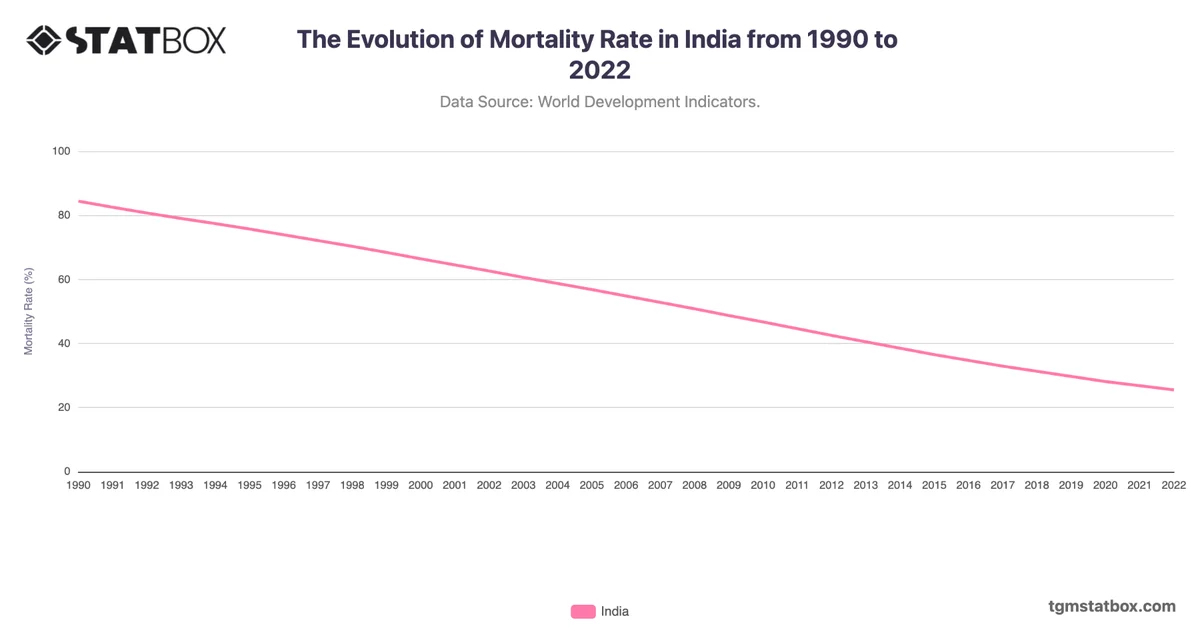
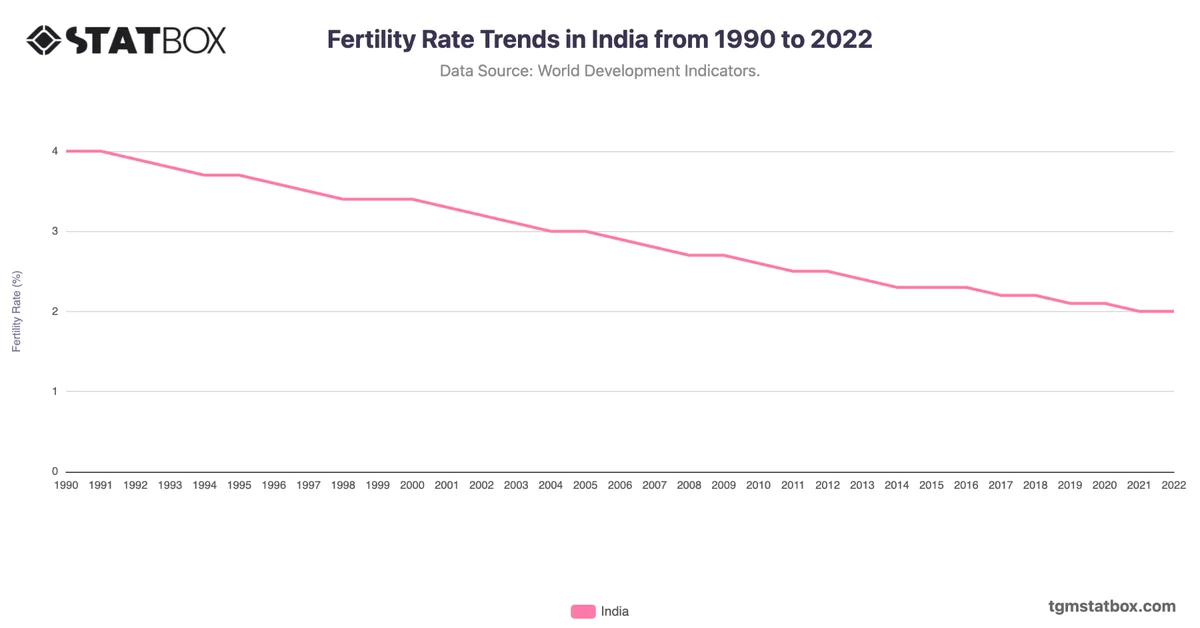
India's death rate declined significantly from 10.7 in 1990 to 6.6 in 2017, driven by better healthcare, improved sanitation, and economic growth. The steady decline highlights the success of nationwide vaccination programs and maternal health initiatives.
The sharp increase to 9.4 in 2021 reflects the impact of the COVID-19 pandemic, including healthcare system strain and high mortality during successive waves. Recovery in 2022 brought the rate down slightly to 9.1, though it remains elevated compared to pre-pandemic levels, underscoring the pandemic's lasting health impact.
The sharp increase to 9.4 in 2021 reflects the impact of the COVID-19 pandemic, including healthcare system strain and high mortality during successive waves. Recovery in 2022 brought the rate down slightly to 9.1, though it remains elevated compared to pre-pandemic levels, underscoring the pandemic's lasting health impact.
For additional information, visit statistics on India’s birth longevity rate, India’s population figures, India’s population density.