Share the statistic on social media channels or embed the statistic in your website using "Embed Code", where available.
Share chart
Embed chart Embed copied!Cite this statistic and select one of the following formats: APA, Chicago, Harvard, MLA & Bluebook
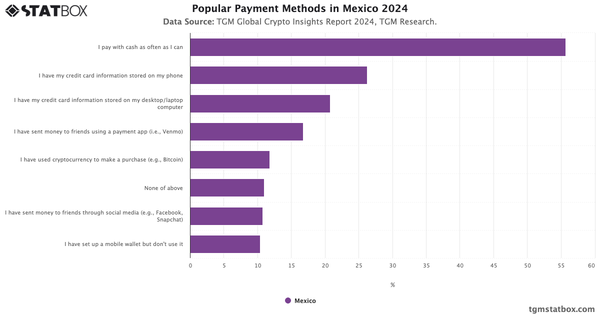
"Which of the following statements about paying for things are true for you?"
Key Takeaways
In the Netherlands, cash is still pretty popular, about 1 in 4 people (25%) say they pay with cash as often as they can. At the same time, around 17% use payment apps to send money to friends. Interestingly, a notable portion haven’t really adopted any of these methods yet, suggesting some room for growth in digital payment options. Cryptocurrency purchases are happening but remain relatively niche for now.
Gain a broader perspective by reviewing top cryptocurrency exchanges in the Netherlands, crypto interest in the Netherlands, Cryptocurrency ownership and usage rates in the Netherlands.

Cryptocurrency Insights Report in the Netherlands
Learn more about Cryptocurrency users in the Netherlands with TGM StatBox. Explore in-depth insight report, featuring user behavior, trends, and preferences.
Go to report


Connect with our expert team for immediate assistance or comprehensive market analysis. We are always ready to support your business needs.