Share the statistic on social media channels or embed the statistic in your website using "Embed Code", where available.
Share chart
Embed chart Embed copied!Cite this statistic and select one of the following formats: APA, Chicago, Harvard, MLA & Bluebook
"How often do you use ridesharing apps?"
Key Takeaways
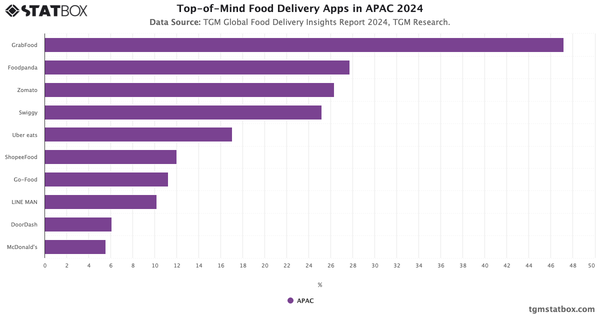
In the APAC region, a significant 54.93% of users rely on ride-hailing apps frequently, using them almost every day, few times a week, or once a week. This group represents users who incorporate ride-hailing into their regular transportation habits, driven by factors such as convenience, cost-effectiveness, time savings, and safety.

Ride-Hailing Insights Report in APAC
Discover insights into ride-hailing in APAC with TGM StatBox. Access our detailed report, including graphs and insights, to uncover the industry's trends.
Go to report


Connect with our expert team for immediate assistance or comprehensive market analysis. We are always ready to support your business needs.