Share the statistic on social media channels or embed the statistic in your website using "Embed Code", where available.
Share chart
Embed chart Embed copied!Cite this statistic and select one of the following formats: APA, Chicago, Harvard, MLA & Bluebook
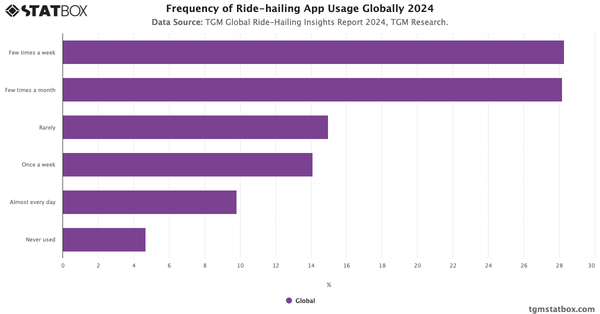
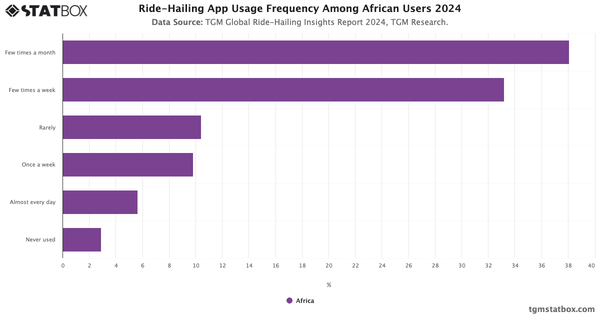
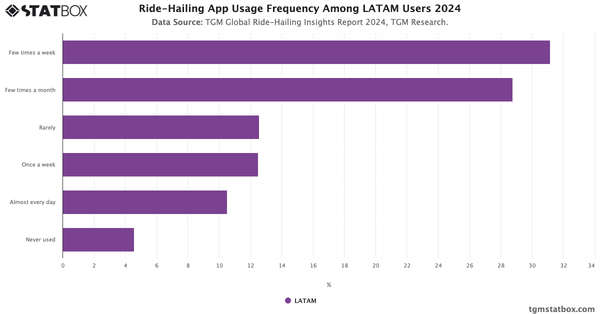
"How often do you use ridesharing apps?"
Key Takeaways
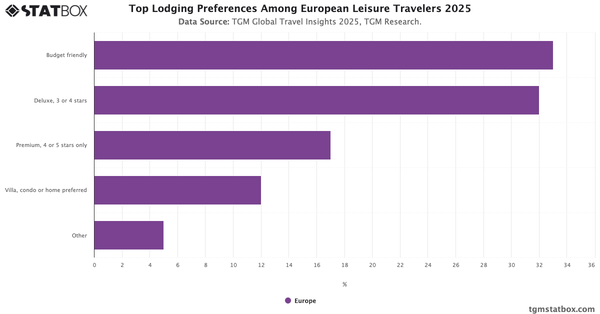
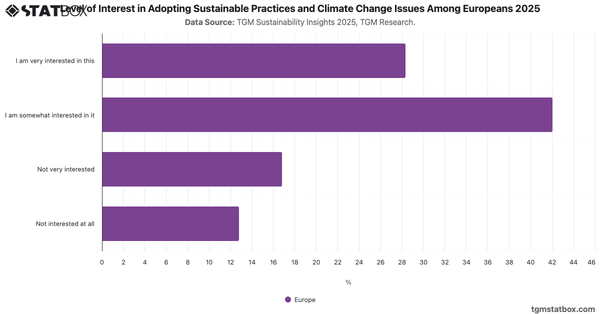
Ride-hailing platforms have become an essential part of European transportation habits, with 42.57% of users utilizing these apps at least once a week. Additionally, a larger group uses the apps "few times a month," indicating more occasional usage. However, a notable portion reports using ride-hailing services "rarely."

Ride-Hailing Insights Report in Europe
Discover insights into ride-hailing in Europe with TGM StatBox. Access our detailed report, including graphs and insights, to uncover the industry's trends.
Go to report


Connect with our expert team for immediate assistance or comprehensive market analysis. We are always ready to support your business needs.