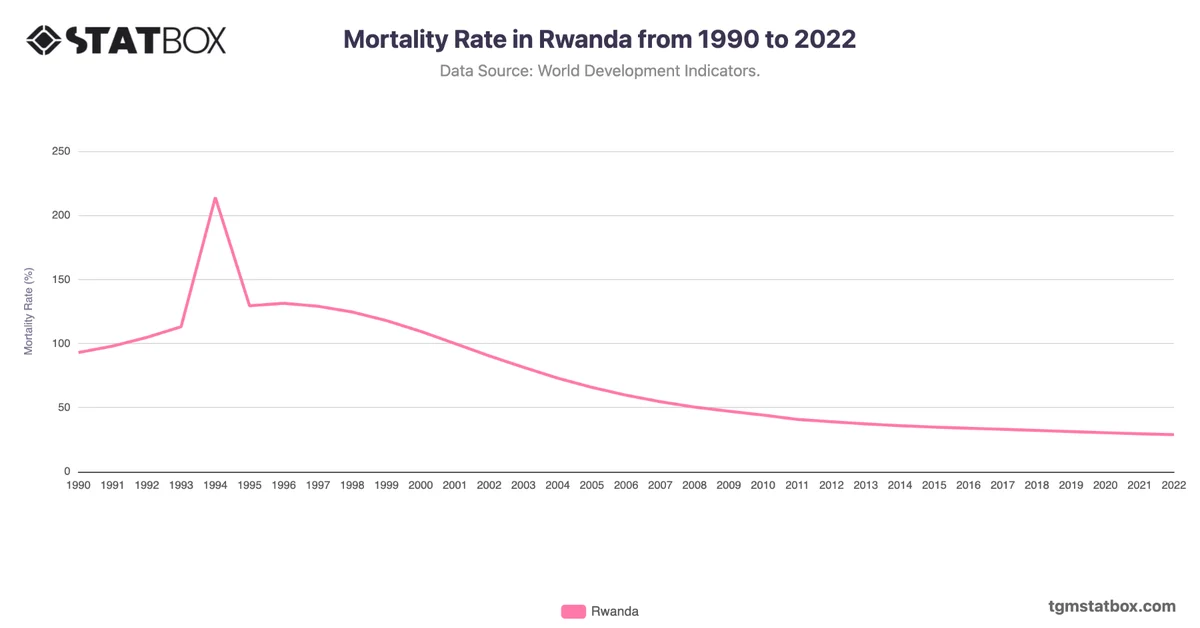
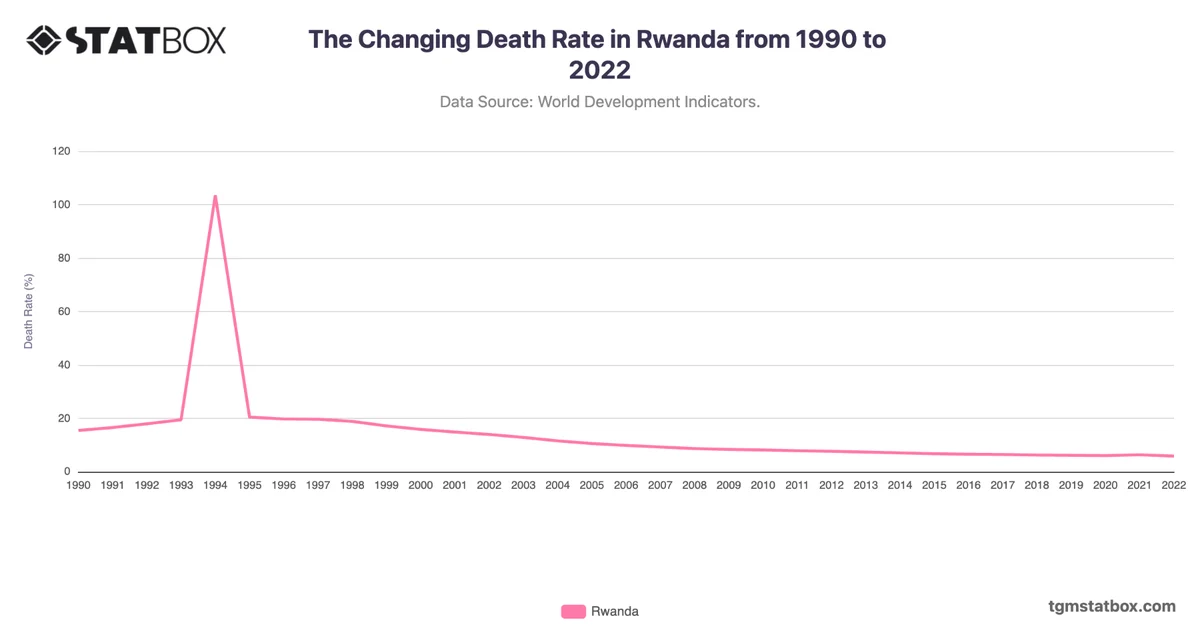
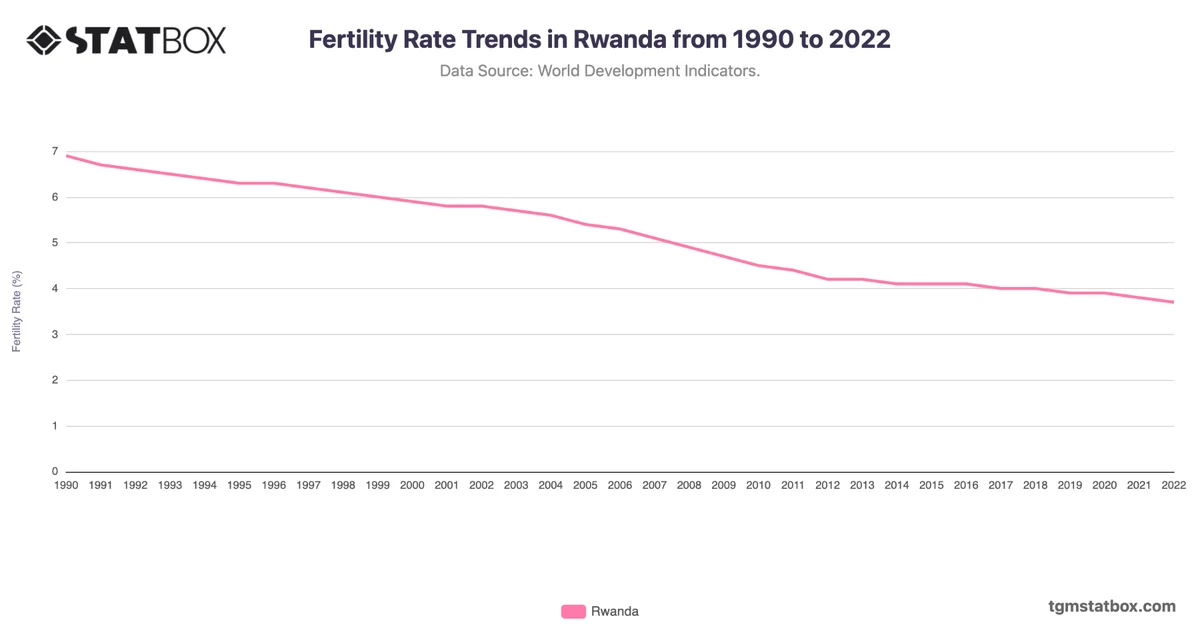
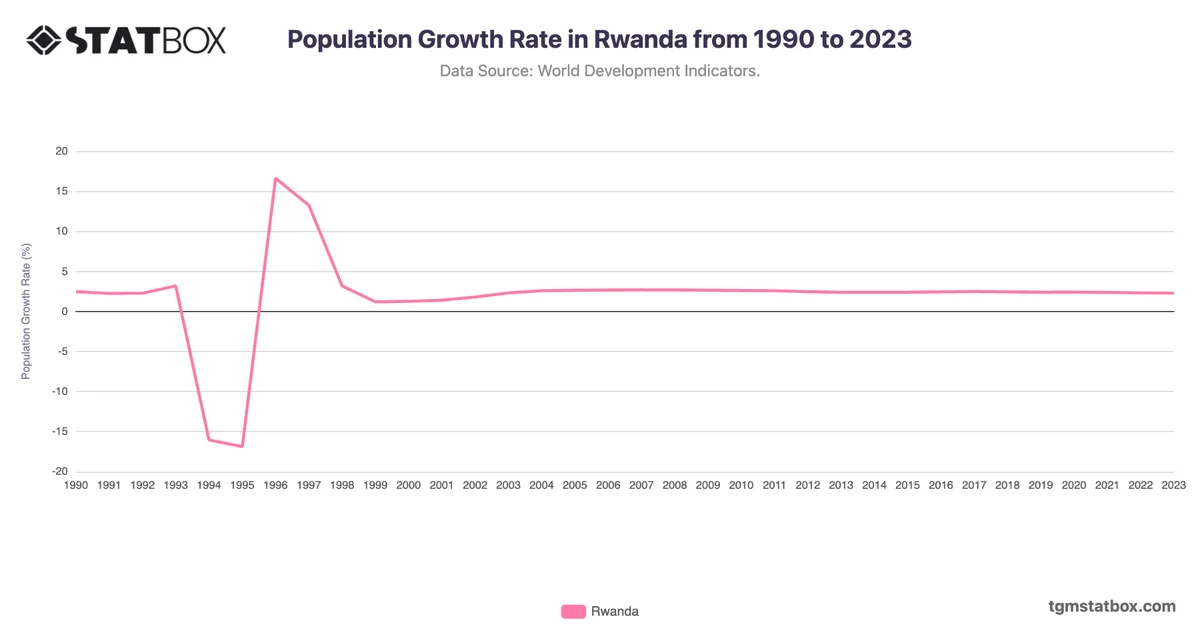
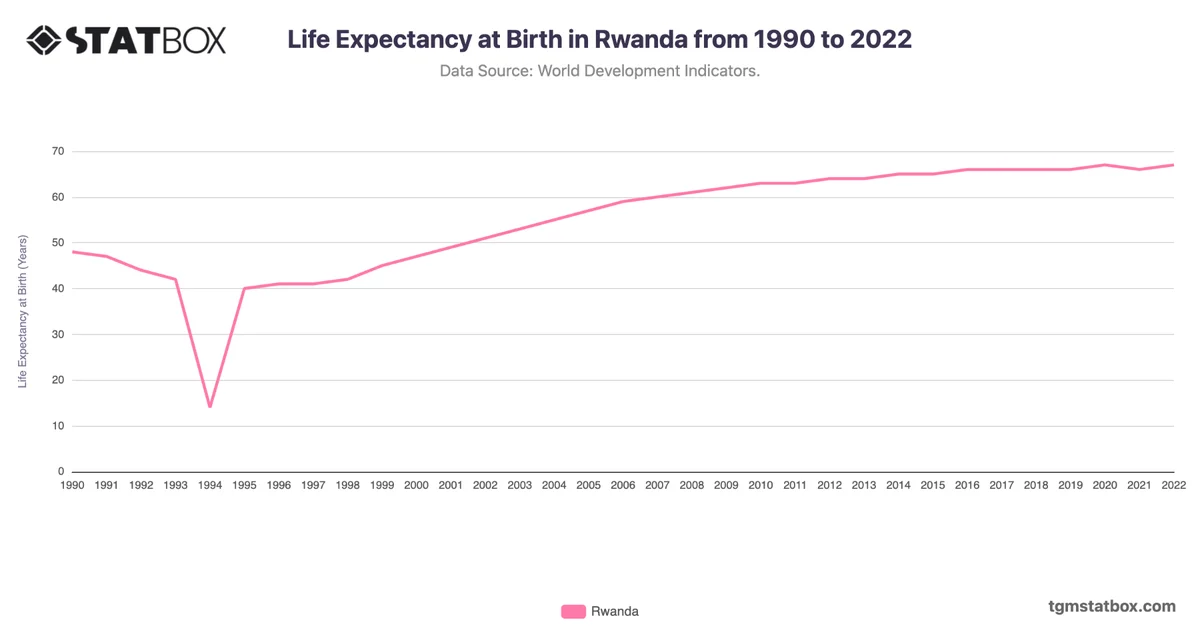
The agriculture sector in Rwanda has experienced significant fluctuations in its contribution to GDP over the past three decades, reflecting the country’s historical, economic, and social transformations. In the early 1990s, agriculture accounted for over 32% of GDP, with a peak in 1994 at 49.8%. This sharp increase was driven by the aftermath of the Rwandan Genocide, which severely disrupted other economic sectors, leaving agriculture as a primary source of sustenance and economic activity. However, this period also marked a time of instability and limited productivity.
As Rwanda embarked on recovery and reconstruction, agriculture's share of GDP gradually declined, reaching 31.5% by 1999 and stabilizing around 30-33% during the early 2000s. This trend was influenced by government efforts to diversify the economy, invest in infrastructure, and expand industrial and service sectors. By 2007, agriculture's contribution fell to 26.1%, reflecting the growing dominance of non-agricultural industries.
In recent years, the agriculture sector's share has continued to decrease, reaching 23.6% in 2019, before a slight rebound to 26.7% in 2020 due to the COVID-19 pandemic. The pandemic highlighted agriculture's resilience as global disruptions emphasized the importance of food security. However, by 2022, the sector's contribution stabilized at 24.9%, showcasing the ongoing structural shift toward a more diversified economy.
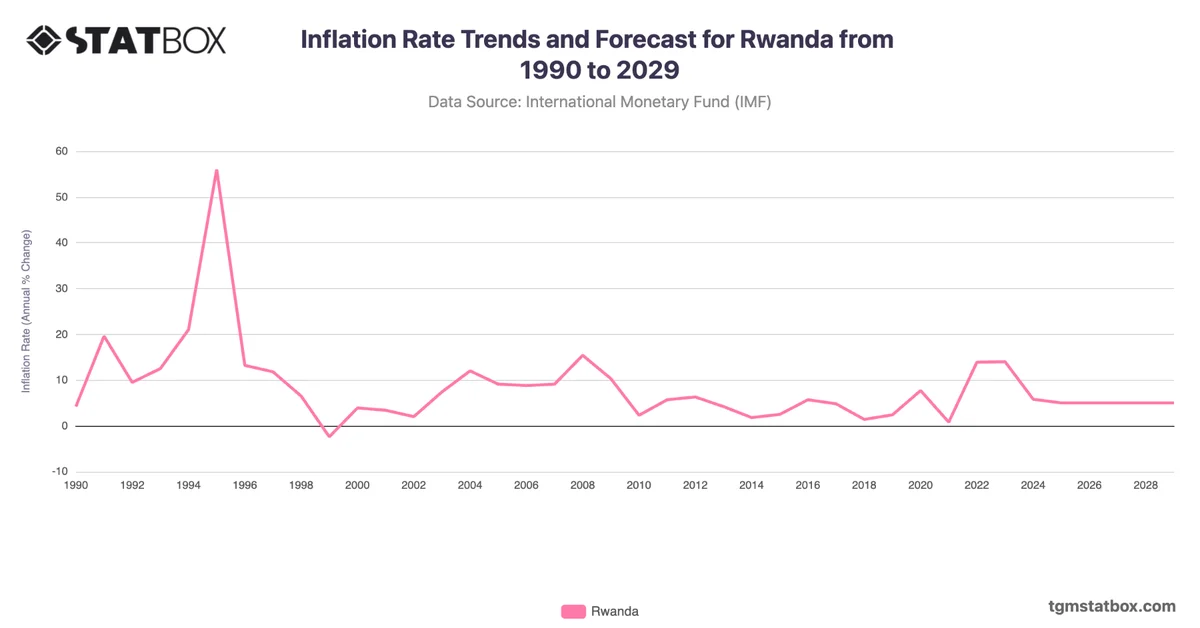
Discover additional trends and data on Rwanda’s manufacturing share in GDP, Rwanda's inflation rate trends, Rwanda’s industry sector share in GDP.