Rwanda's import of goods has demonstrated significant growth over the decades, reflecting its evolving economic landscape and increasing demand for foreign products. In the 1990s, import values fluctuated modestly, with a decline during the Rwandan Civil War and genocide in 1994, dropping to $236 million. Post-conflict recovery saw gradual increases, reaching $297 million by 1997, as reconstruction efforts spurred demand for essential goods. However, the early 2000s experienced slower growth, with imports averaging around $250 million, reflecting limited purchasing power and a reliance on subsistence agriculture.
The mid-2000s marked a turning point, driven by government-led infrastructure projects and economic liberalization. Import values surged from $471 million in 2005 to over $1 billion by 2008, fueled by investments in construction materials and machinery. The upward trajectory continued into the 2010s, with imports exceeding $2 billion by 2011, supported by growing industrialization and urbanization. By 2023, imports reached $3.86 billion, reflecting increased consumption of manufactured goods and raw materials, as Rwanda continues its economic transformation and integration into global trade networks.
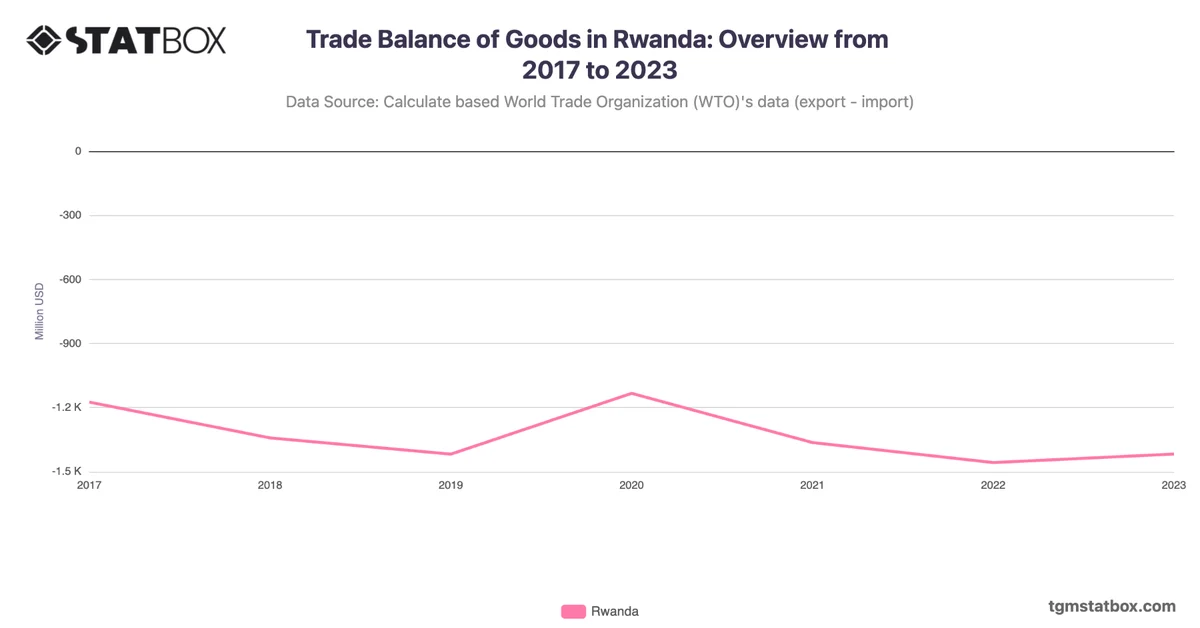
Discover additional trends and data on Rwanda’s military spending, Rwanda’s urban expansion, Rwanda’s goods trade balance.