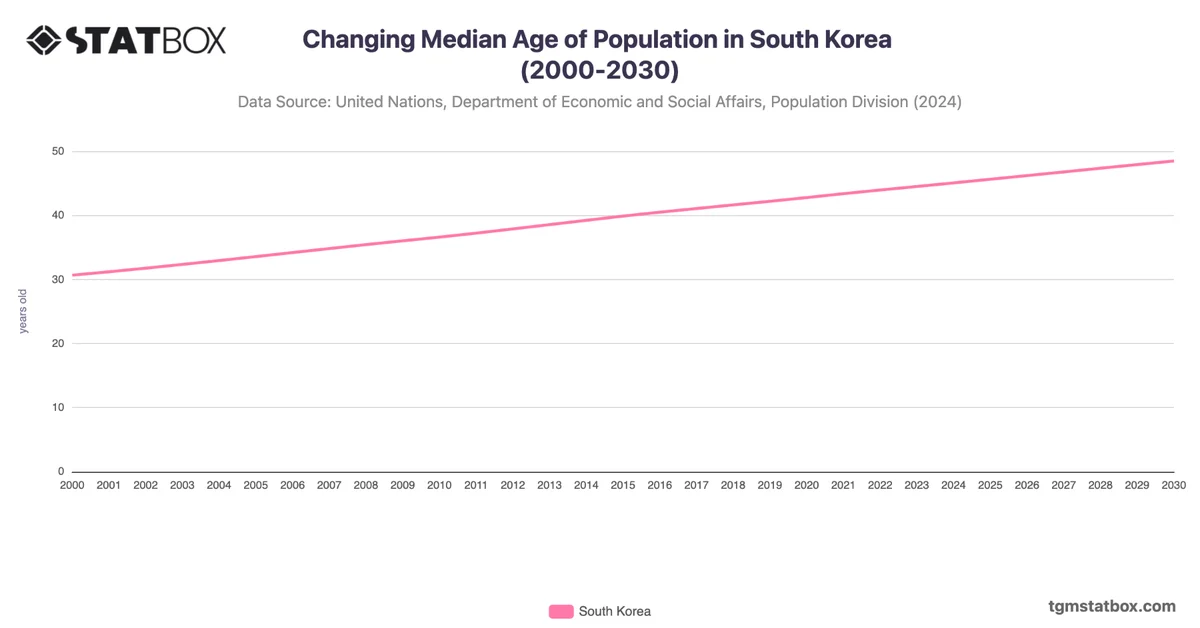
South Korea's death rate remained low and stable from 1990 to 2009, hovering around 5.0, thanks to robust healthcare, economic growth, and significant public health campaigns. The gradual increase from 2010, reaching 7.3 in 2022, reflects the nation's aging population, a demographic trend similar to Japan's.
The spike to 6.2 in 2021 is attributed to COVID-19, though the relatively low rate compared to global figures underscores South Korea's strong healthcare response. The overall upward trend highlights the demographic shift and the need for sustainable elderly care solutions.
The spike to 6.2 in 2021 is attributed to COVID-19, though the relatively low rate compared to global figures underscores South Korea's strong healthcare response. The overall upward trend highlights the demographic shift and the need for sustainable elderly care solutions.
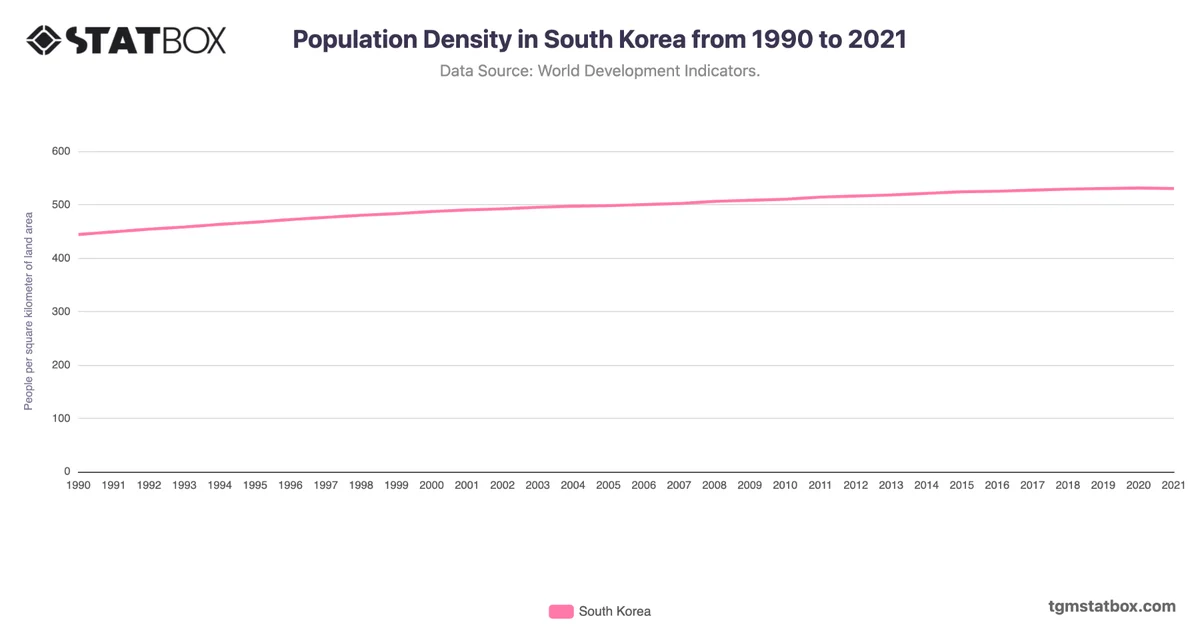
For a broader context, visit other statistics on South Korea’s net lending/borrowing as percentage of GDP, South Korea’s population density, South Korea’s military-to-population ratio.