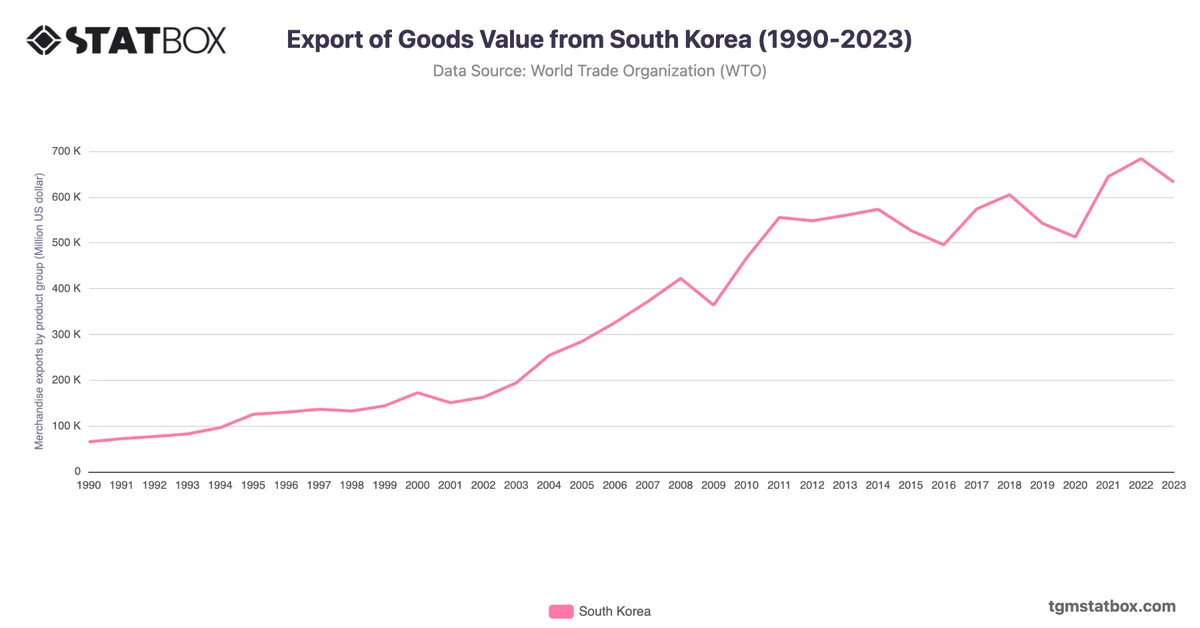
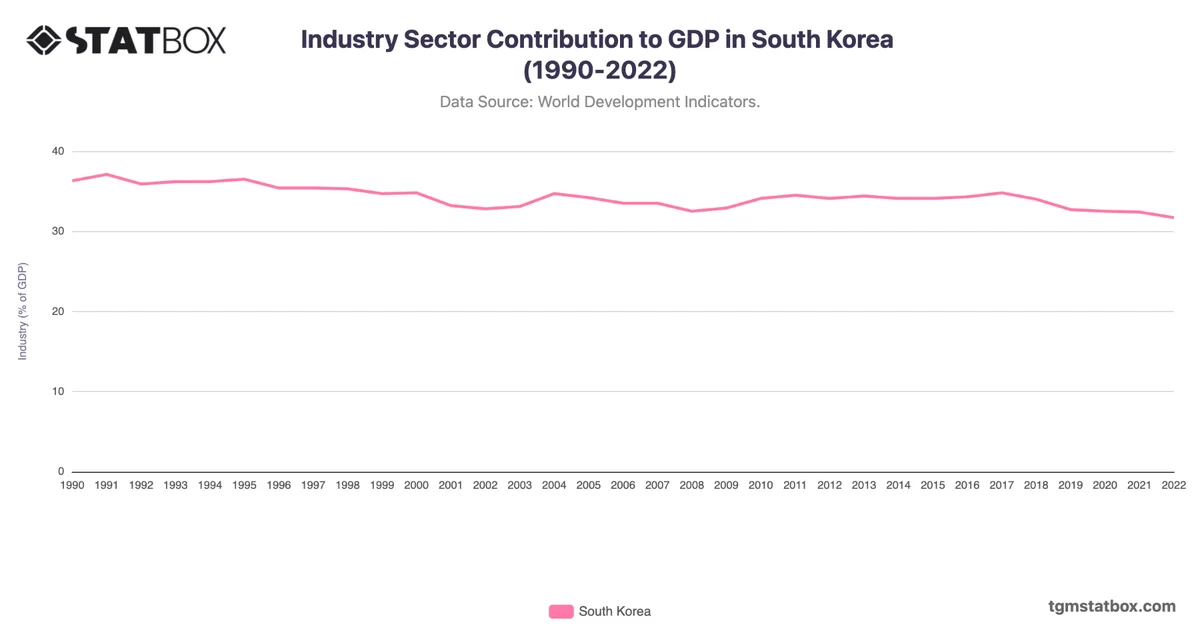
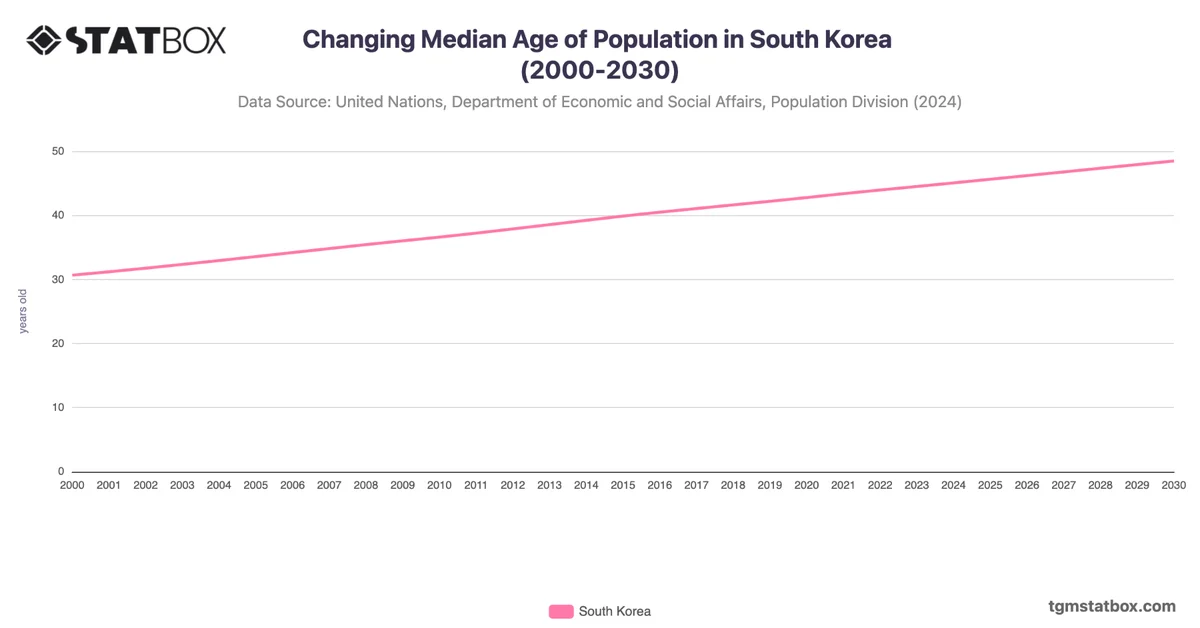
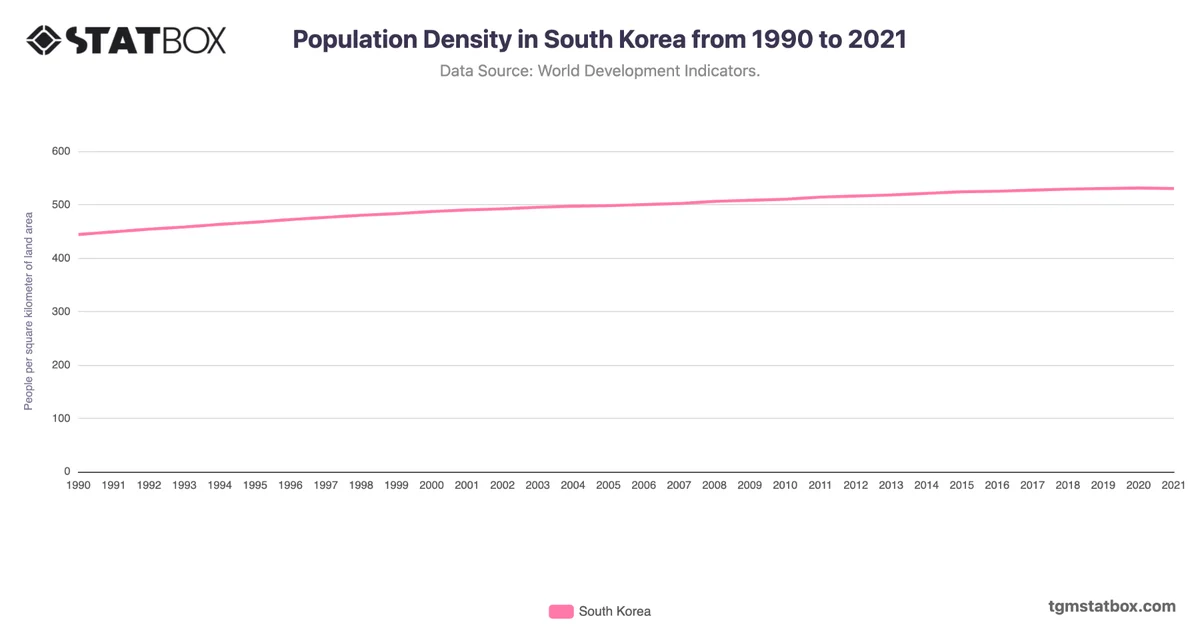
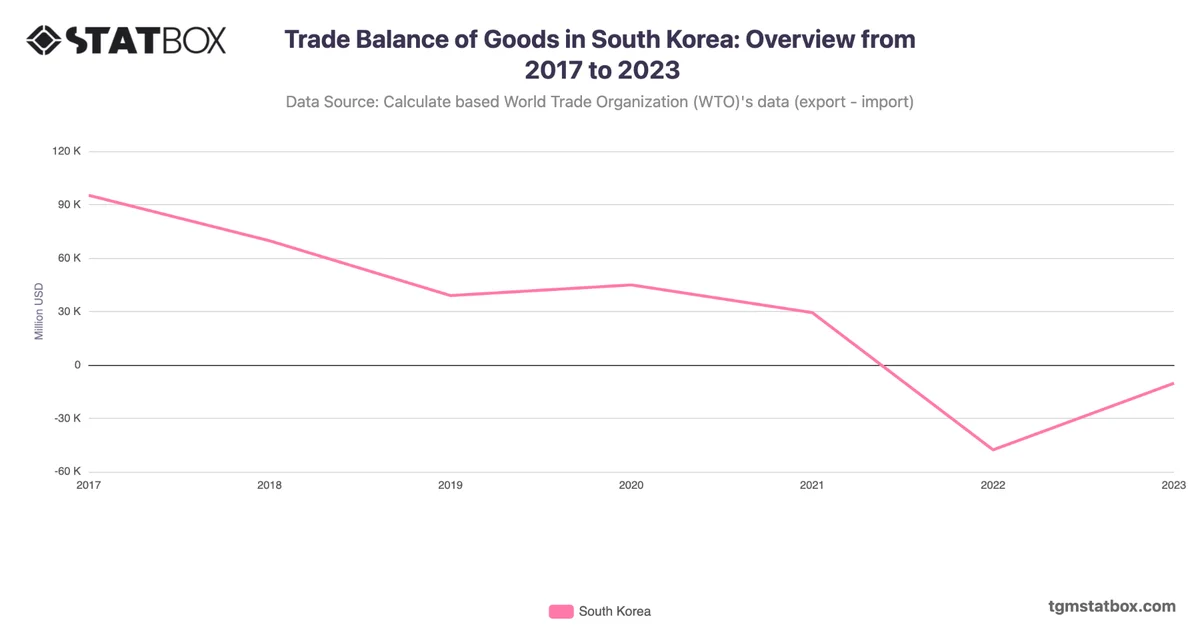
South Korea's GDP illustrates its transformation from a war-torn economy to a global technology leader. From $2.4 billion in 1961, GDP rose rapidly during the 1970s and 1980s due to export-driven policies, reaching $116 billion in 1986. By 1995, GDP had soared to $566 billion, fueled by electronics and automotive exports.
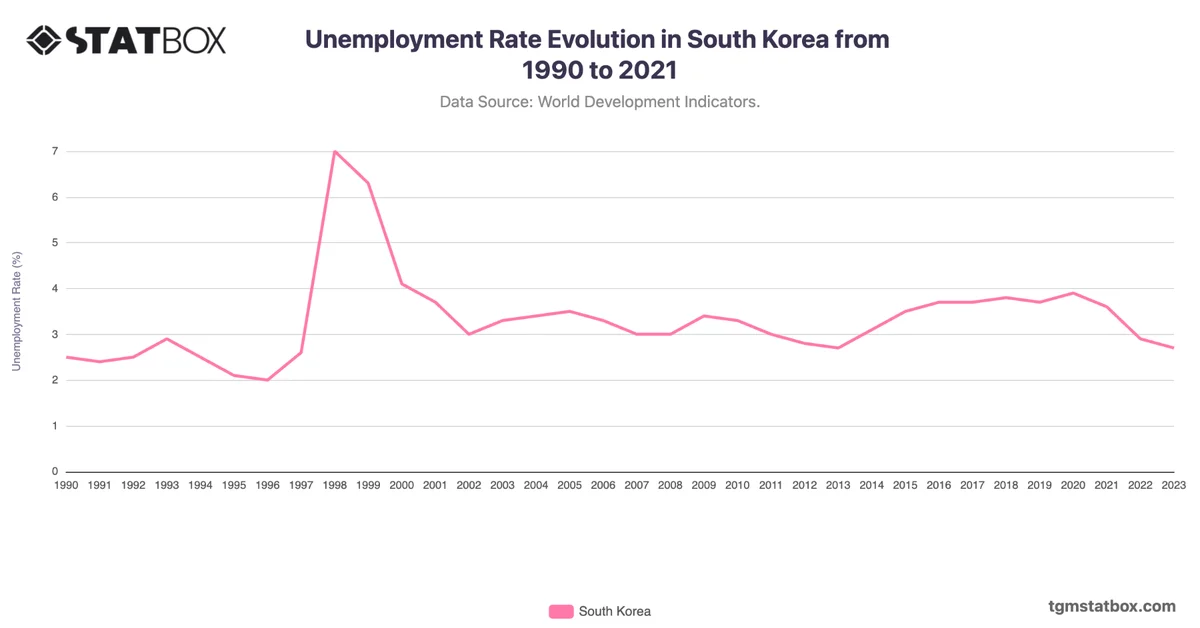
Despite a sharp contraction during the 1997 Asian Financial Crisis, South Korea rebounded, surpassing $1 trillion in 2006. In 2023, GDP stood at $1.71 trillion, reflecting its robust technology sector and global competitiveness in semiconductors and electronics.
Despite a sharp contraction during the 1997 Asian Financial Crisis, South Korea rebounded, surpassing $1 trillion in 2006. In 2023, GDP stood at $1.71 trillion, reflecting its robust technology sector and global competitiveness in semiconductors and electronics.
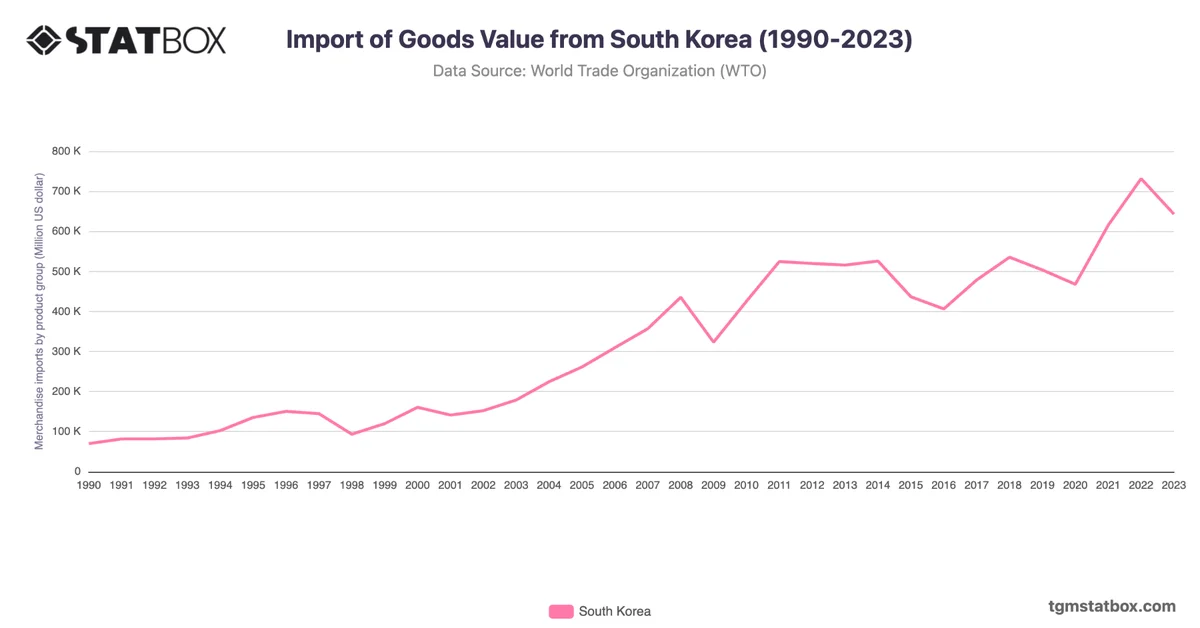
Gain a broader perspective by reviewing South Korea’s annual GDP growth rate, South Korea’s import figures, South Korea’s net lending/borrowing as percentage of GDP.