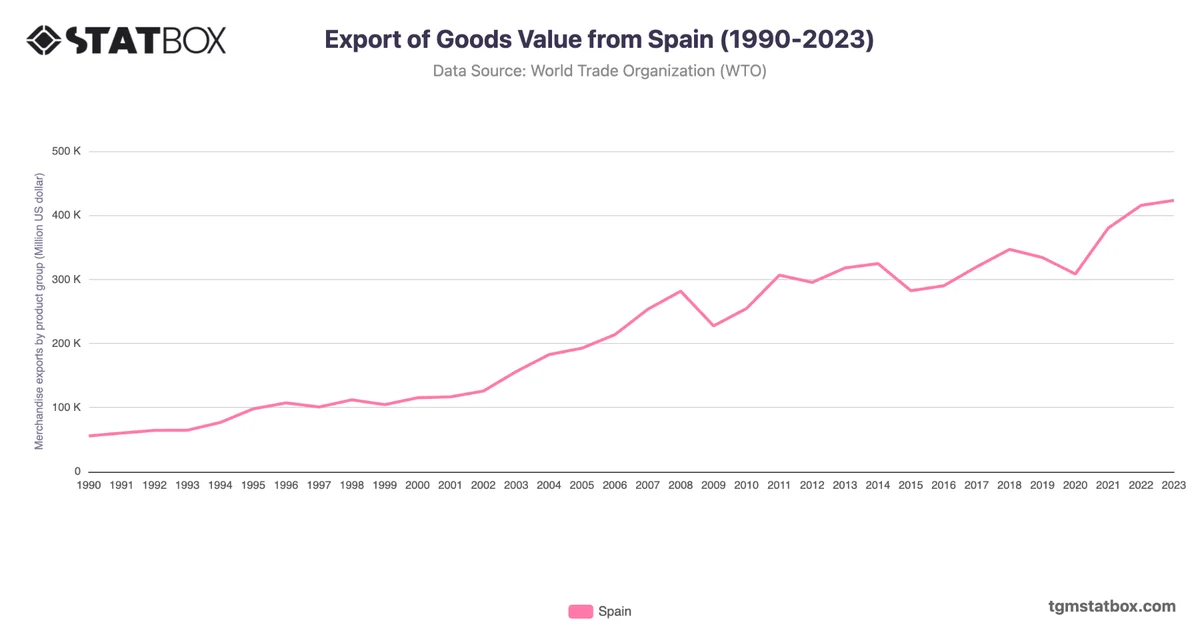
Spain’s imports surged from $87.7B in 1990 to $494.3B in 2022, driven by EU integration and a growing consumer economy. The early 2000s marked significant growth, with imports jumping from $208.6B in 2003 to $420.8B in 2008 due to robust construction and industrial sectors.
The financial crisis caused a decline to $293.2B in 2009, but imports rebounded, peaking at $494.3B in 2022, reflecting rising energy costs and renewed consumer demand. The 2023 figure of $470.3B indicates slight stabilization amidst economic adjustments.
The financial crisis caused a decline to $293.2B in 2009, but imports rebounded, peaking at $494.3B in 2022, reflecting rising energy costs and renewed consumer demand. The 2023 figure of $470.3B indicates slight stabilization amidst economic adjustments.
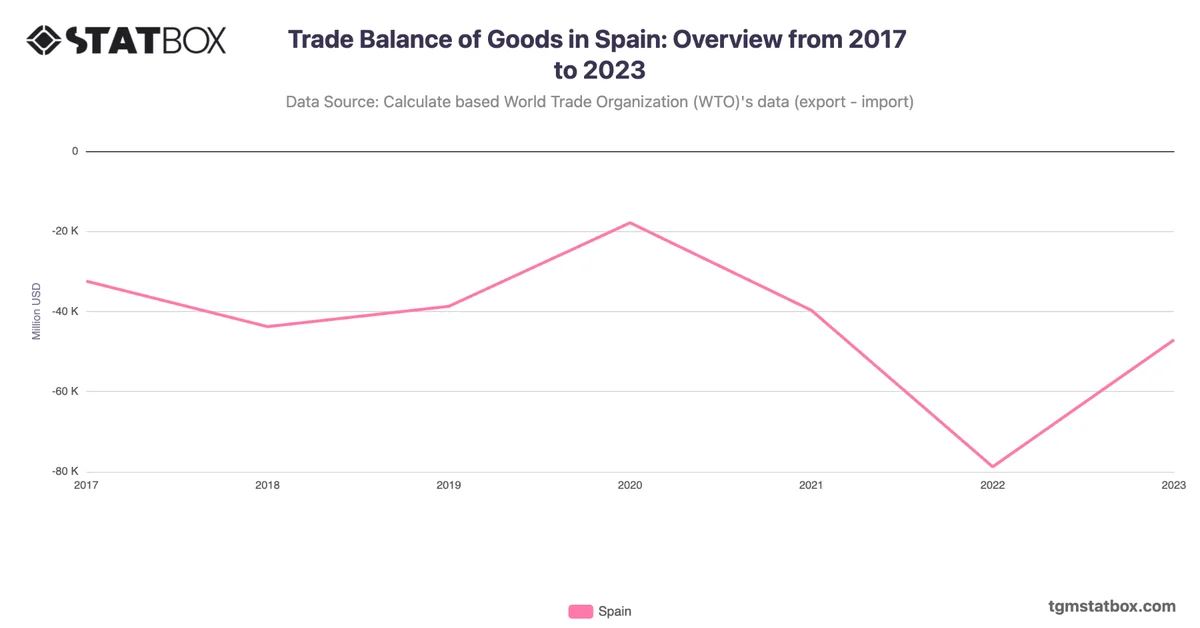
For a broader context, visit other statistics on Spain’s yearly GDP growth rate, Spain’s defense spending, Spain’s goods trade balance.