Turkey’s GDP highlights its growth as a regional economic power. Starting at $7.9 billion in 1961, Turkey experienced significant expansion during the 1980s due to liberalization, with GDP reaching $150.6 billion in 1990. The 2001 financial crisis caused a dip to $201.7 billion, but reforms spurred recovery.
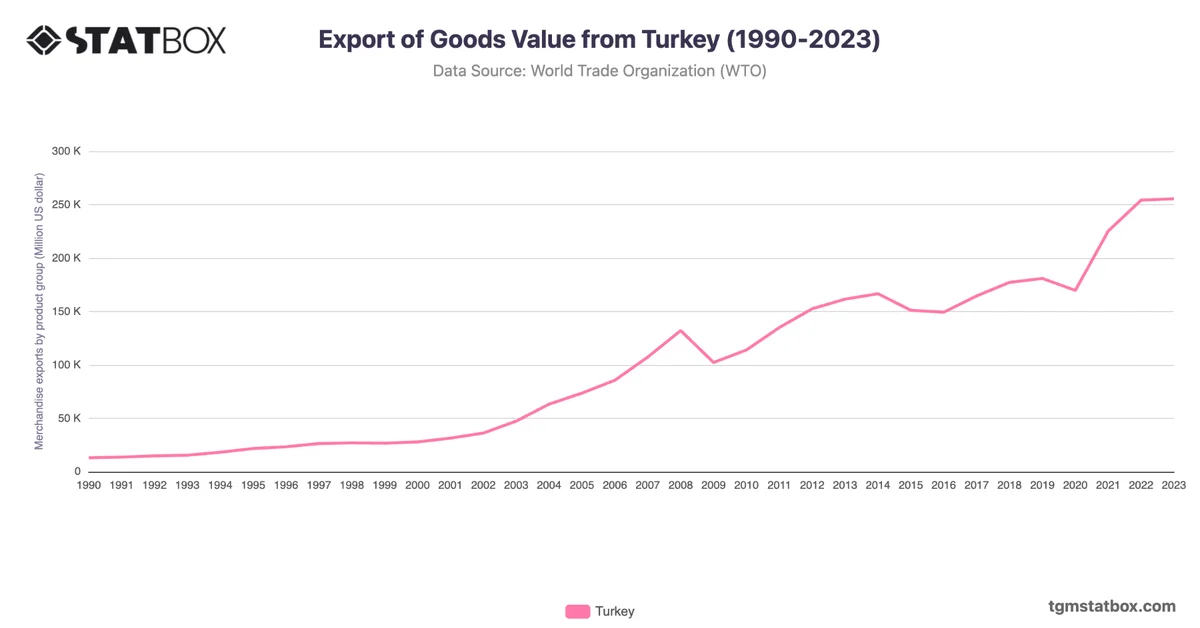
The economy peaked at $957.8 billion in 2013 before declining due to political and economic instability. By 2023, Turkey's GDP rebounded to $1.1 trillion, driven by diversified exports, infrastructure development, and robust manufacturing sectors.
The economy peaked at $957.8 billion in 2013 before declining due to political and economic instability. By 2023, Turkey's GDP rebounded to $1.1 trillion, driven by diversified exports, infrastructure development, and robust manufacturing sectors.
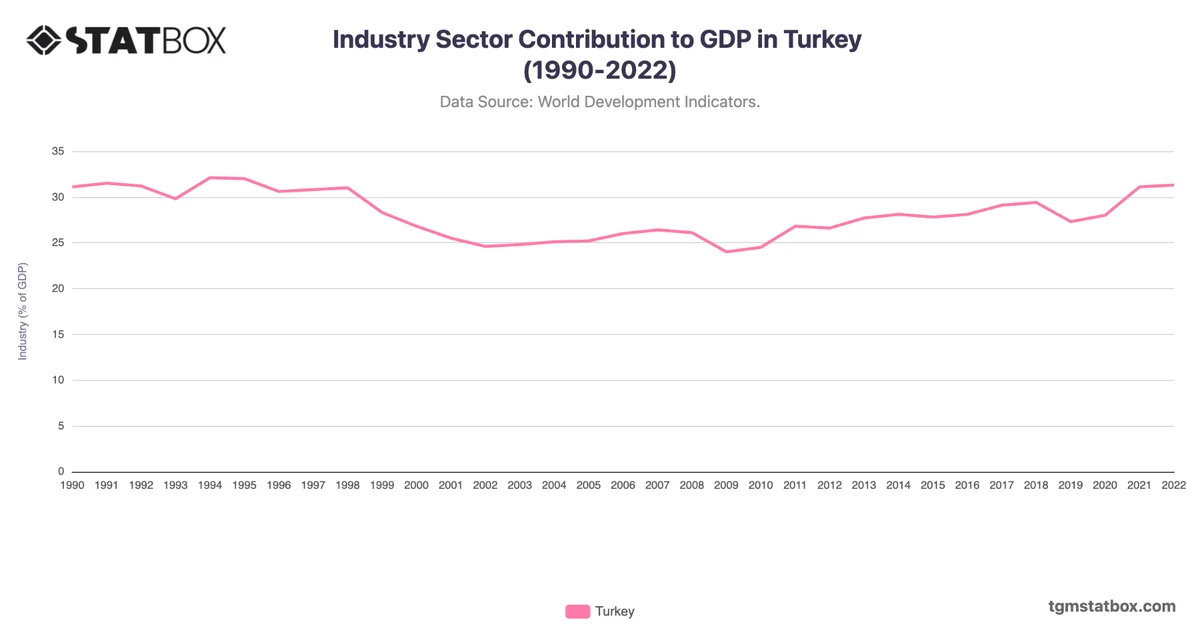
Gain a broader perspective by reviewing Turkey’s industry sector GDP share, Turkey’s population overview, Turkey’s manufacturing sector share in GDP.