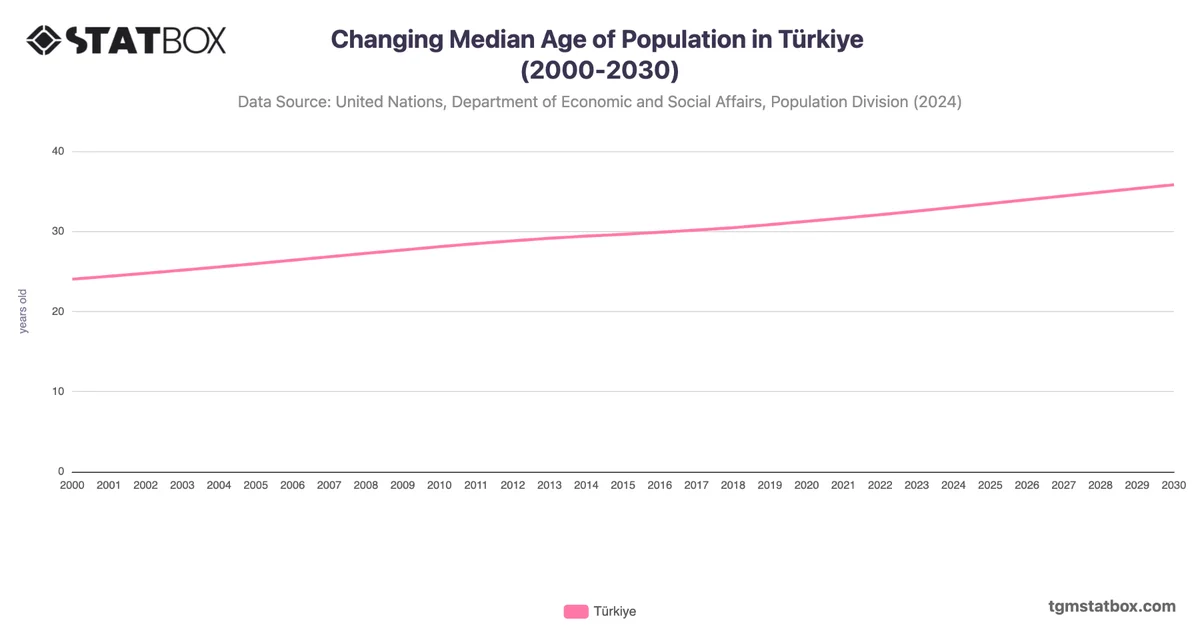
Turkey's population growth rate has gradually declined from 1.9% in 1990 to 0.4% in 2023, reflecting demographic transitions and economic development. The 1990s saw consistent growth rates around 1.8%, driven by a youthful population and urbanization. However, the rate dropped to 1.3% by the mid-2000s as fertility rates declined, influenced by improved access to education and family planning.
By 2020, growth fell to 1.0%, further impacted by the pandemic's social and economic disruptions. The sharp decrease to 0.4% in 2023 indicates a continued trend of declining birth rates and emigration, highlighting the need for policies addressing workforce sustainability and demographic aging.
By 2020, growth fell to 1.0%, further impacted by the pandemic's social and economic disruptions. The sharp decrease to 0.4% in 2023 indicates a continued trend of declining birth rates and emigration, highlighting the need for policies addressing workforce sustainability and demographic aging.
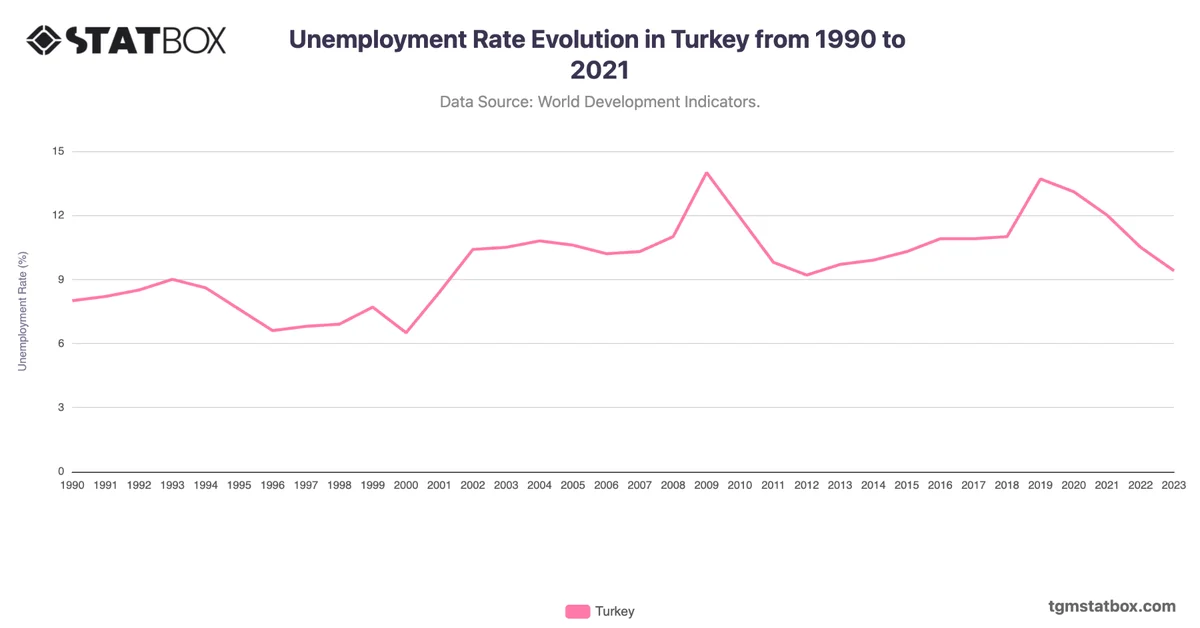
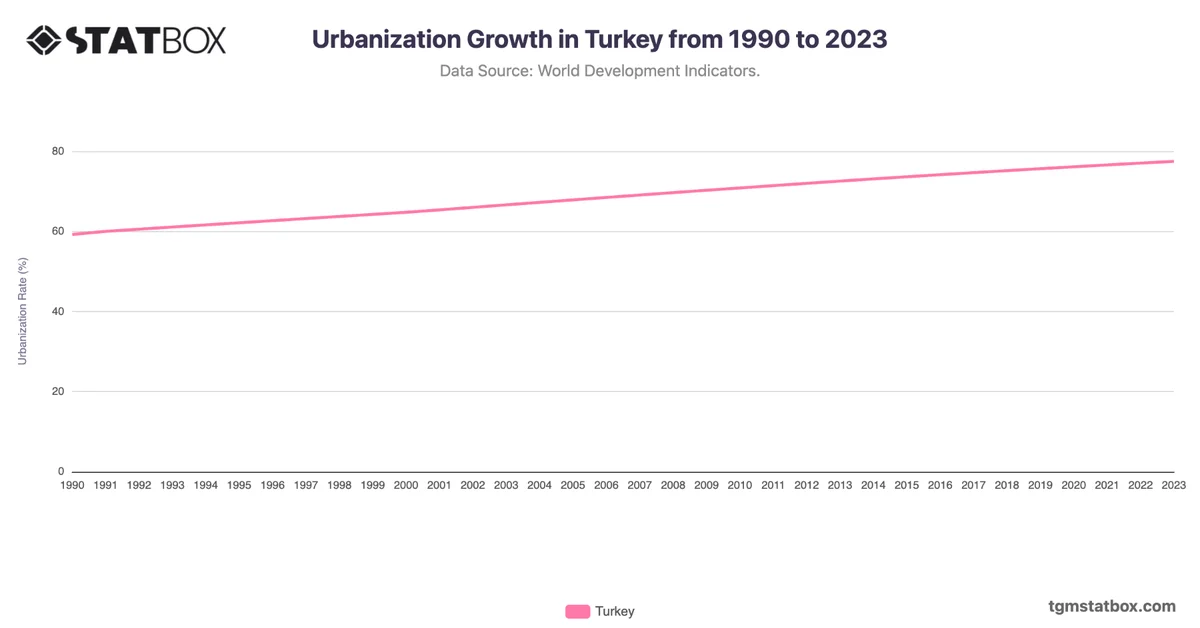
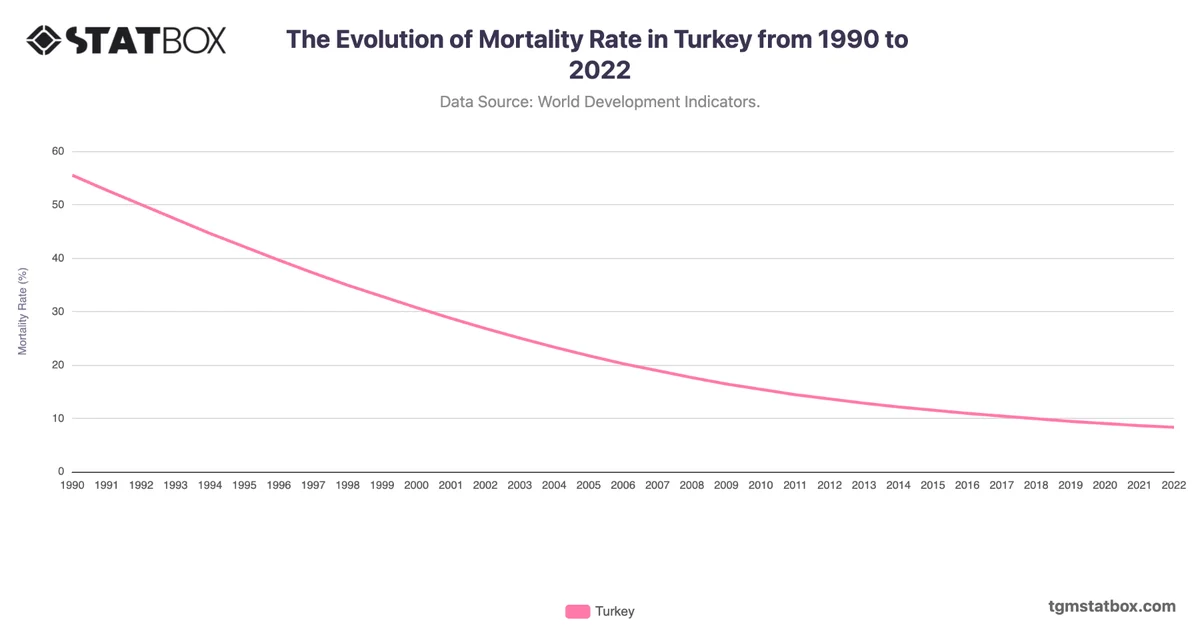
Explore related charts to gain a better understanding of Turkey’s unemployment rate, Turkey’s population density, urbanization rate in Turkey.