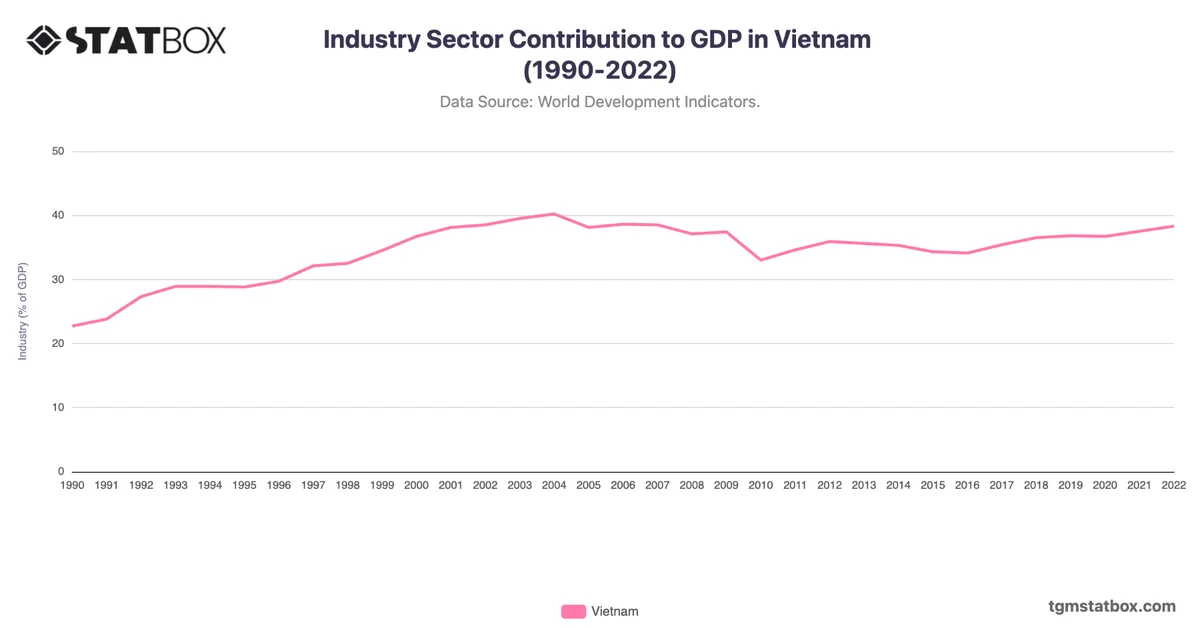
Vietnam’s GDP reflects its transition from a centrally planned economy to a market-oriented system. Starting at $14.1 billion in 1985, economic reforms under Đổi Mới in 1986 spurred steady growth, with GDP reaching $77.4 billion by 2007. Key drivers include export-oriented manufacturing and agriculture.
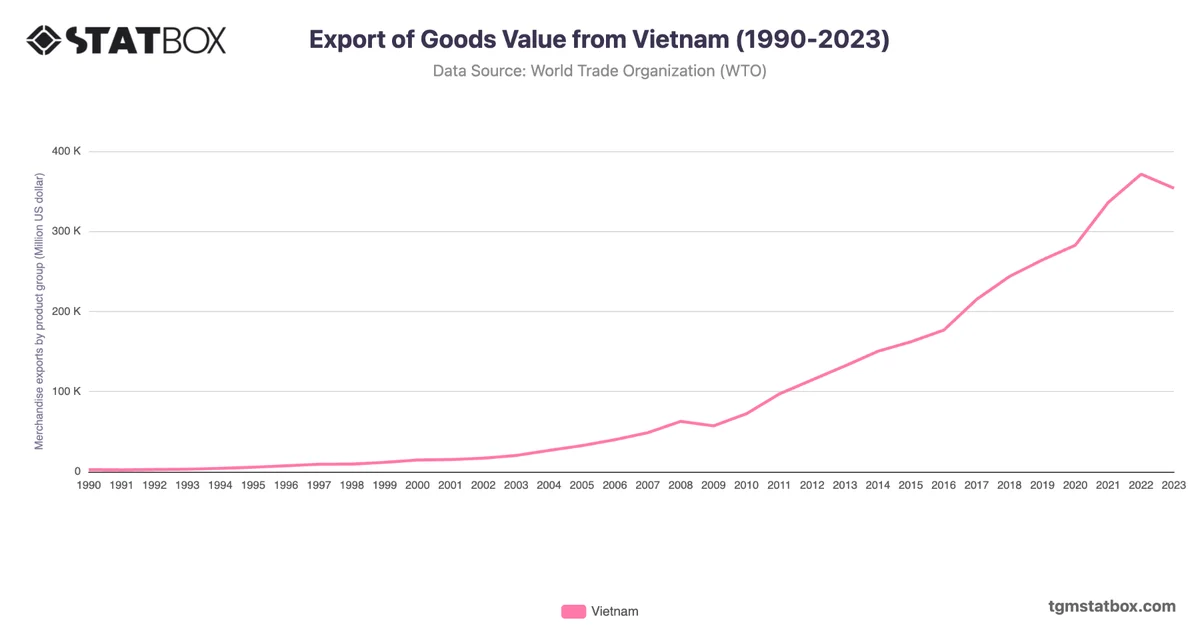
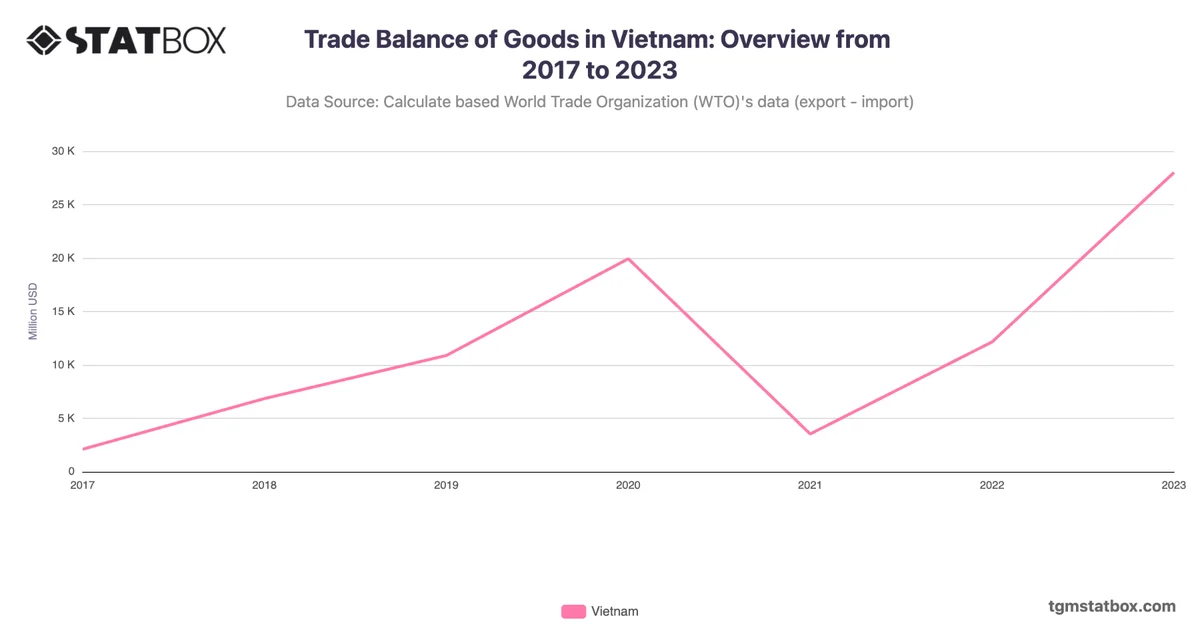
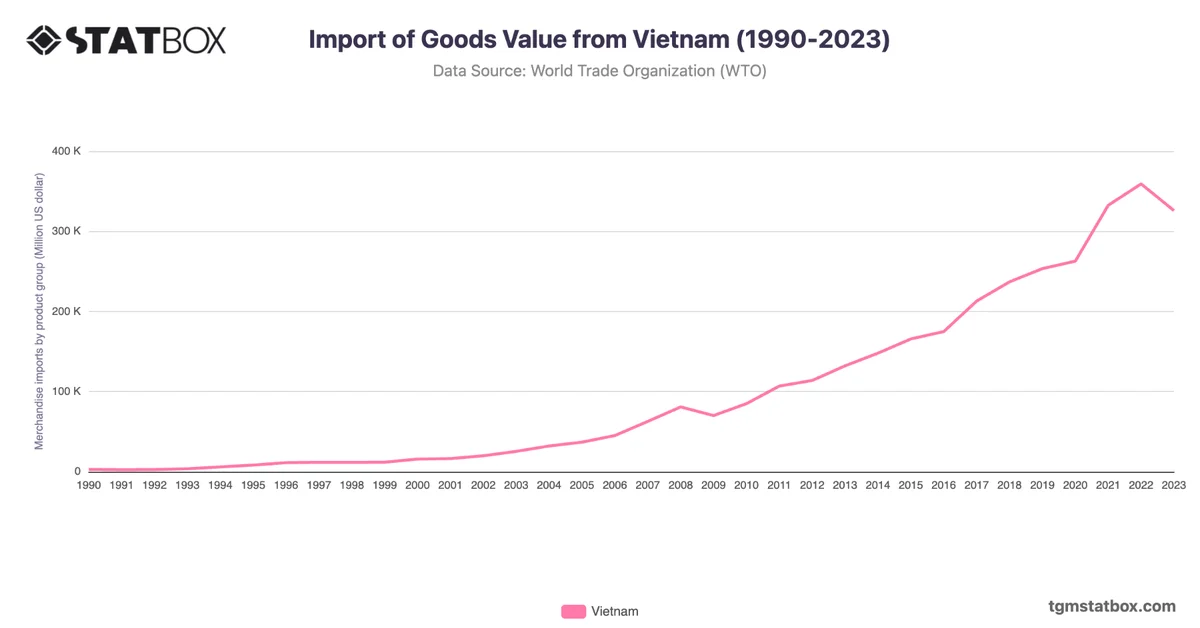
By 2023, Vietnam’s GDP surged to $429.7 billion, underpinned by robust export growth, foreign direct investment, and diversification into electronics and high-tech industries. Resilience during the global COVID-19 pandemic further cemented its reputation as a dynamic emerging economy.
By 2023, Vietnam’s GDP surged to $429.7 billion, underpinned by robust export growth, foreign direct investment, and diversification into electronics and high-tech industries. Resilience during the global COVID-19 pandemic further cemented its reputation as a dynamic emerging economy.
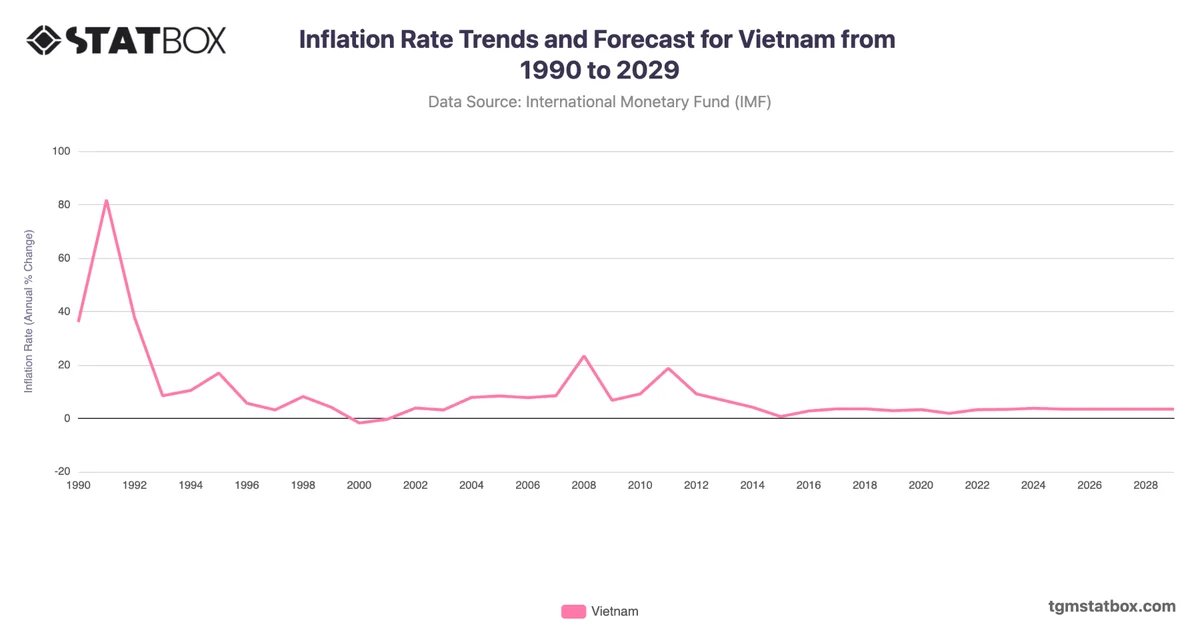
Discover additional trends and data on Vietnam’s agriculture share in GDP, Vietnam\'s inflation rate trends, Vietnam’s services sector share in GDP.